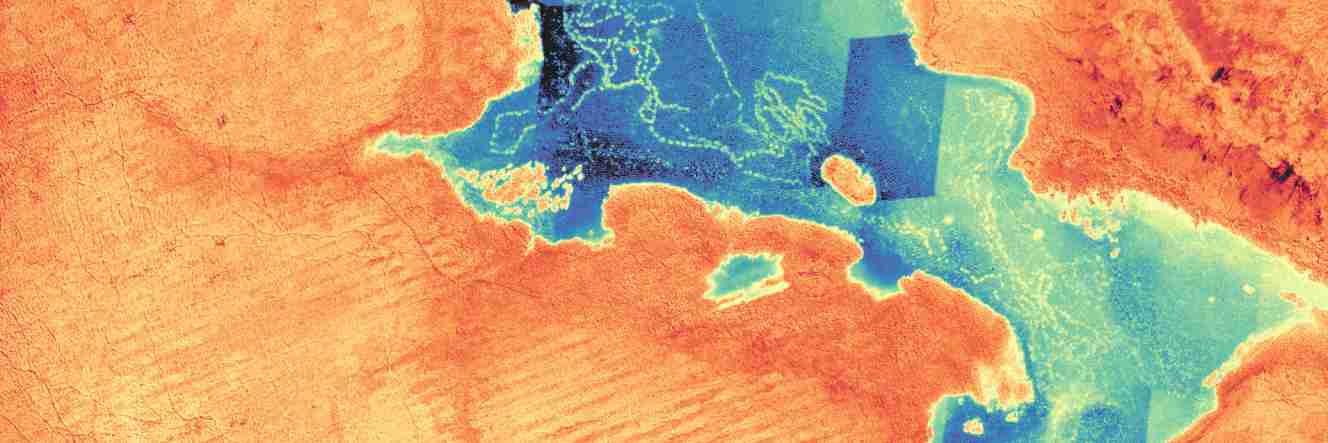
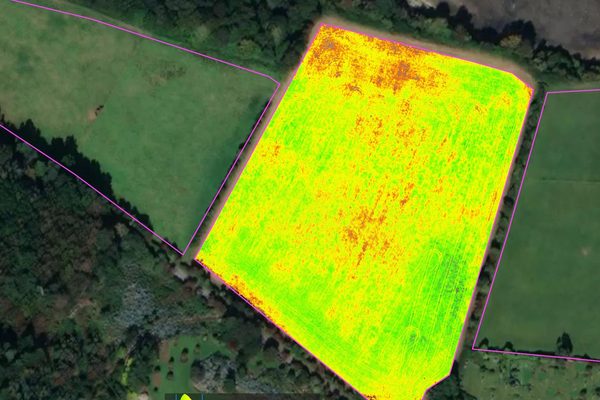
A field that looks uniformly green to the naked eye may contain crops at very different stages of stress, nitrogen deficiency, or disease. Multispectral imaging makes those differences visible by capturing light across wavelength bands beyond the visible spectrum — near-infrared, red edge, and green — and combining them into index maps that reveal what standard photography cannot.
The key is knowing which index answers which question. NDVI tells you overall crop health across the whole field. NDRE detects early-stage nitrogen deficiency before it becomes visually apparent — in time to act. GNDVI analyses chlorophyll content in mature crops. We generate all three from a single flight, alongside a full-resolution RGB orthomosaic for visual context. The right combination depends on your crop type, growth stage, and what decision you are trying to make.
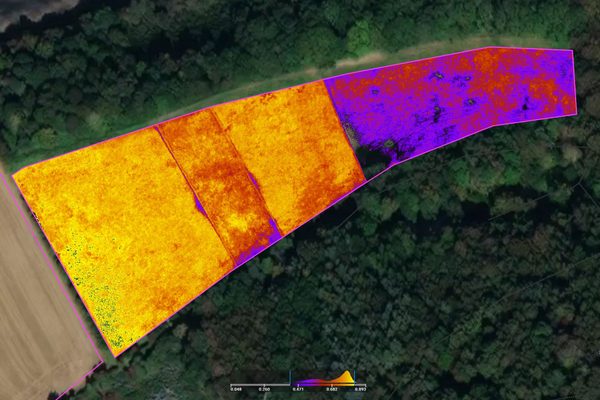
Multispectral index maps let you identify areas of the field that require attention before any visual symptom appears. Nutrient deficiency, water stress, and disease outbreaks all produce spectral signatures that are detectable at the canopy level before they become visible to the eye. Variable-rate application decisions can be made from the same survey data, targeting inputs to the zones that need them rather than spreading uniformly across the whole field.
Multispectral surveys can identify areas of contrasting vegetation health across a site, distinguish between vegetation types by their spectral response, and detect the presence of invasive species where their reflectance profile differs from native vegetation. Change detection across repeat surveys provides a structured record of how a site evolves over time — useful for habitat monitoring, condition reporting, and environmental impact assessment.
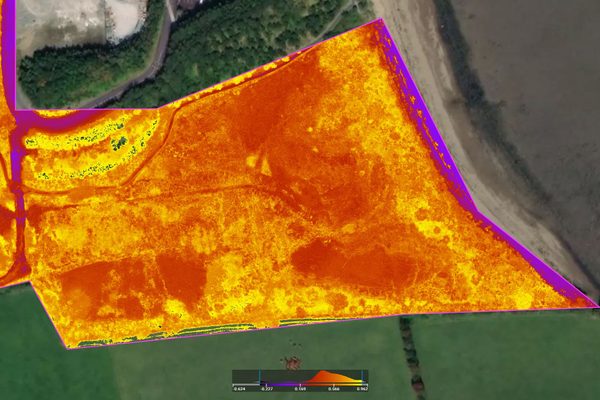
Water stress produces a measurable spectral response before it causes visible wilting. Multispectral surveys identify areas of the field showing early moisture deficit, allowing irrigation to be targeted rather than applied uniformly. For larger holdings or sites with variable soil type across the field, this makes a material difference to both water use and yield outcomes.
Multispectral surveys provide objective data on vegetation cover, soil condition, and land productivity across a holding. For land purchase, disposal, or dispute resolution, index maps provide a documented, repeatable basis for assessing condition at a point in time. Change detection between surveys can also demonstrate improvement or deterioration of soil quality over time.
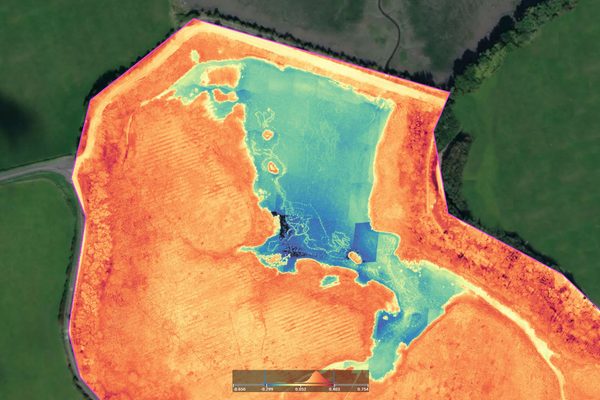
Multispectral imagery tells you what is happening to your crops or vegetation — where growth is stressed, where chlorophyll levels are low, where moisture is uneven. But it does not tell you why. An elevation model from LiDAR completes the picture: a stressed area at the bottom of a slope is likely suffering from waterlogging; a stressed area on a south-facing slope may be drought-stressed; a stressed area on flat ground with no obvious drainage issue may need a soil sample, not more irrigation.
Why combine multispectral imagery with an elevation model?
Multispectral data shows you crop stress patterns. An elevation heatmap shows you the terrain that caused them. When you overlay the two, patterns that looked random in the NDVI map often resolve into something predictable: low-lying areas with poor drainage, south-facing slopes with higher evapotranspiration, or frost pockets at the bottom of valleys.
The practical value is that it changes the agronomist’s response. A stress patch caused by a drainage problem needs a drain, not more fertiliser. A stress patch caused by slope aspect may be unremarkable. Without the elevation layer, all stress looks the same — and every stressed patch gets the same investigation. With it, you can prioritise.
More about LiDAR and elevation mappingCan a single drone flight capture both multispectral and elevation data?
Not in a single flight — multispectral and LiDAR sensors are carried on separate payloads and require different flight parameters. But both surveys can typically be flown on the same day, over the same site, producing two datasets that align to the same coordinate system and overlay directly in GIS or precision agriculture software.
The combined deliverable — an NDVI or GNDVI map overlaid on a Digital Terrain Model — gives your agronomist or land manager the full picture: what the plants are doing, and what the ground is doing underneath them.
Discuss combined multispectral and elevation surveys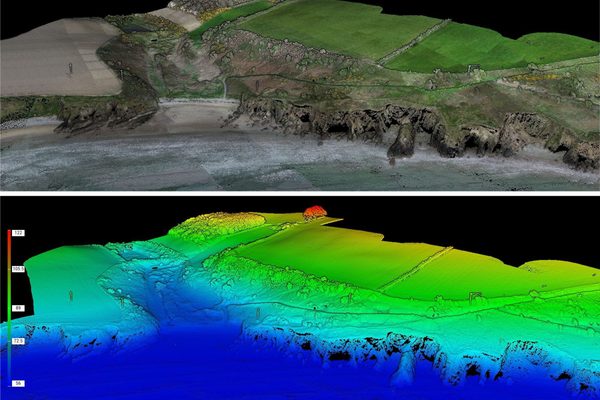


Nutrient deficiency and early water stress produce measurable spectral changes before any symptom appears to the eye or shows up in a standard photograph — leaving time to intervene.
The Mavic 3M captures Green, Red, Red Edge, and Near Infrared bands simultaneously. NDVI, NDRE, and GNDVI are all generated from one sortie — no repeat flight for a different index.
The built-in upward-facing sunlight sensor logs irradiance against every frame. Surveys flown weeks or months apart are directly comparable — change in the data reflects change on the ground, not change in the light.
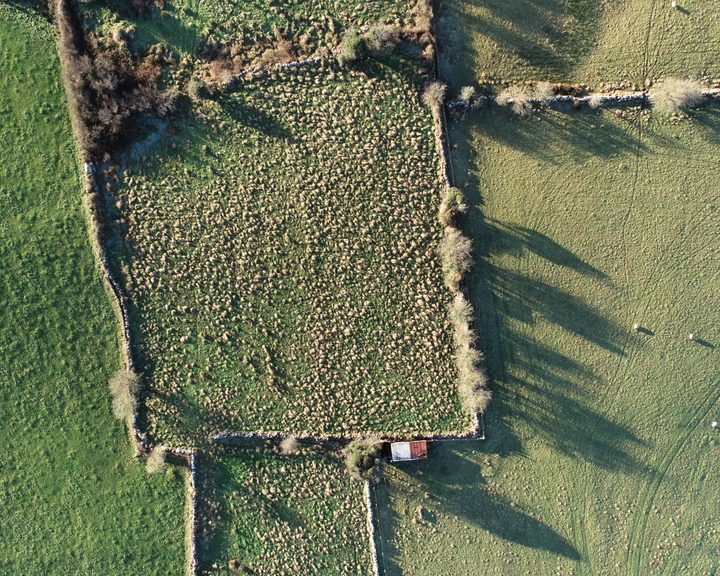
A full-resolution colour orthomosaic is produced on the same flight as the multispectral data, providing visual context for every index map output at no additional sortie cost.
At standard operating altitude, full-farm coverage for most Irish agricultural holdings is a practical same-day operation. Large sites are covered in a single mobilisation.
Index maps are delivered in formats compatible with VRT-enabled application equipment. Variable-rate fertiliser or treatment plans can be built directly from the survey output.
NDVI (Normalised Difference Vegetation Index) compares near-infrared to red reflectance. Healthy, actively photosynthesising plants absorb red light and reflect near-infrared strongly. Stressed or sparse vegetation does the opposite. NDVI is the standard broad-brush health index — the starting point for any crop survey. It gives you a whole-field view of biomass density and general vigour, and is most useful early in the season or when you need a quick overview of variation across a large area.
NDRE — early nitrogen stress detection. The red-edge band is particularly sensitive to chlorophyll content and nitrogen status. NDRE detects early-stage nutrient deficiency significantly before NDVI responds — a crop under nitrogen stress will show NDRE changes before any visual symptom appears. For variable-rate fertiliser decisions and early intervention, NDRE is the more useful index.
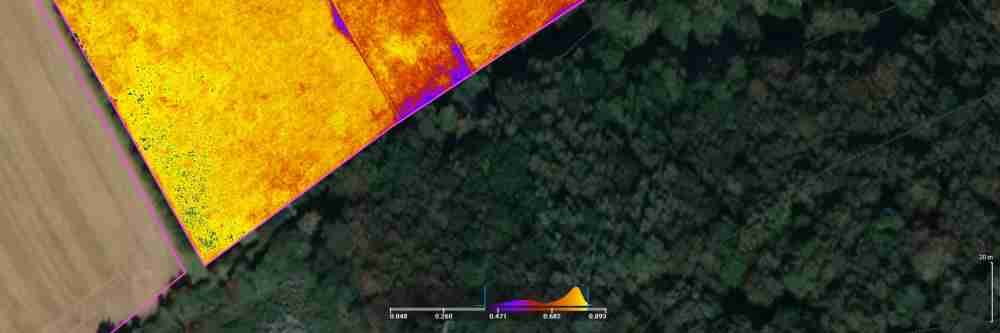
GNDVI (Green Normalised Difference Vegetation Index) uses near-infrared and green reflectance. Green reflectance is sensitive to leaf chlorophyll concentration rather than photosynthetic activity alone. GNDVI is particularly useful for mature, dense-canopy crops where NDVI saturates at high biomass values — it can no longer distinguish between a healthy dense canopy and a very healthy dense canopy. GNDVI does not saturate in the same way and is the recommended index for late-season crop analysis.
The right combination of indices depends on your crop type, growth stage, and the decision you are trying to make. We advise on index selection as part of every survey commission.
The Mavic 3M carries five cameras simultaneously: four multispectral sensors (Green 560 nm, Red 650 nm, Red Edge 730 nm, Near Infrared 860 nm) and a 20 MP RGB camera. A fifth upward-facing sensor records solar irradiance continuously throughout the flight. On a partly cloudy day, irradiance changes with every cloud that passes — without correction, the same crop photographed in direct sunlight and then under cloud cover produces different apparent NDVI values. Not because the crop changed. Because the light changed.
Irradiance correction normalises reflectance values across the whole dataset regardless of changing light conditions during the flight. More usefully, it means surveys conducted weeks or months apart produce directly comparable outputs — the basis for change detection and longitudinal crop monitoring across multiple seasons.
From a single flight you receive: NDVI, NDRE, and GNDVI index maps (GeoTIFF); a 20 MP RGB orthomosaic; and a raw reflectance dataset. Index maps are delivered in formats compatible with VRT-enabled application equipment. At 200 hectares per sortie, full-farm coverage is a practical same-day operation for most Irish agricultural holdings. Contact us to discuss your survey requirements.
Engineers With Drones used drone-based LiDAR and multispectral sensors to map large areas of farm land across Ireland, providing detailed information about farms and their carbon sequestration potential.
Complex surveys and inspections require more than just a pilot. Our engineers can help you scope your requirements and indentify the right approach.