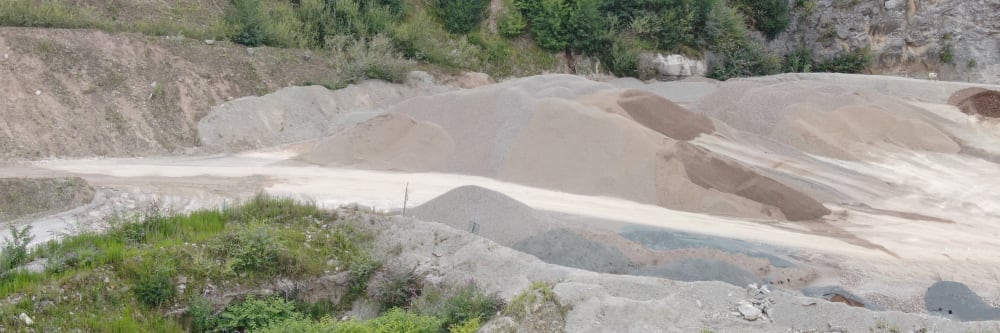
Traditional quarry and landfill surveying means someone walking stockpiles with a GPS rover, climbing faces, and capturing points one at a time over several days. It is slow, physically demanding, and produces a sparse dataset — a surveyor might capture a few hundred points where a drone captures millions. Every point the surveyor does not walk to is a point you never measure.
A drone survey covers the entire site in a fraction of the time. The drone flies a pre-programmed grid pattern and captures overlapping imagery with survey-grade positional accuracy. From that single flight, you can get stockpile volume calculations, cut and fill analysis, an orthomosaic site map, and a topographic surface model — all from data captured in hours, not days.
How accurate is a drone volume survey?
A drone survey using RTK positioning can typically achieve vertical accuracy within a few centimetres. The key advantage over manual methods is not just precision but density — where a ground survey might capture a few hundred points across a stockpile, a drone survey captures millions, giving a far more complete representation of the surface for volume calculation.
Every survey includes an accuracy statement in the report, so you know the confidence level of the volume figures before using them for inventory, contractual, or regulatory purposes.
More about stockpile volume measurementWhat is an orthomosaic map?
An orthomosaic is a high-resolution aerial image of the entire site, made by stitching together hundreds of individual drone photographs. Unlike a single aerial photo, an orthomosaic has been geometrically corrected so that the scale is uniform across the whole image — you can measure true distances and areas directly from it.
Quarry and landfill operators use orthomosaics for site planning, extraction sequencing, regulatory submissions, and as a visual baseline to compare against future survey dates.
More about 3D mapping and orthomosaic productionCan a drone survey work on an active quarry or landfill?
Yes. The drone operates above the working area and does not interact with vehicles, plant, or personnel on the ground. A site survey can typically be completed without halting extraction, processing, or tipping — work continues below while the drone captures data overhead.
Discuss surveying your active siteWhat regulations cover drone surveys at commercial sites in Ireland?
All drone operations in Ireland are regulated by the Irish Aviation Authority under the EASA framework (S.I. No. 24 of 2023). Engineers with Drones holds an EASA Specific Category Operational Authorisation (IRL.UAS.AUTH1002) — the first company in Ireland to receive this level of authorisation — which permits operations beyond Open category limits, including over industrial and commercial sites.
Before every flight, an airspace check is carried out via the IAA AirSpace app, and a site-specific Risk Assessment and Method Statement is prepared and agreed with the site health and safety officer.
More about our regulatory complianceA single drone flight captures the complete surface of every stockpile on site. Photogrammetry or LiDAR processing produces a dense 3D point cloud, from which precise volume calculations are derived — typically within a few percent of true volume. The result is a volume statement you can use for inventory audits, financial reporting, and contractual verification, with an accuracy that manual ground-based methods cannot match for consistency or coverage.
How does drone volume measurement compare to walking a stockpile with GPS?
A ground surveyor walking a stockpile typically captures a few hundred points across the surface, and the volume is calculated by interpolating between them. A drone survey captures millions of points, producing a far more complete surface model with significantly less interpolation.
Method consistency is another advantage: a drone follows the same flight pattern every time, removing the variability that comes from different surveyors choosing different walking paths. This makes repeat surveys more directly comparable.
More about stockpile volume measurement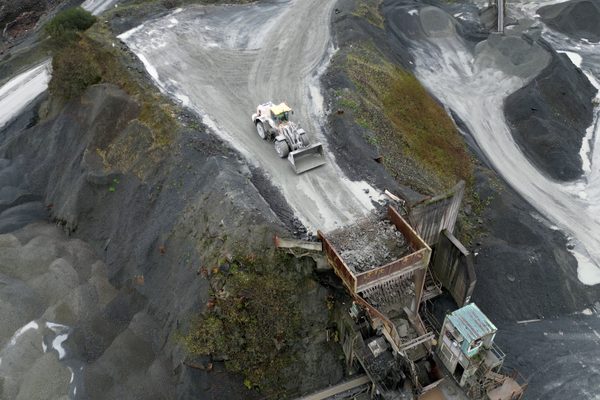
Cut and fill analysis compares two survey dates and calculates exactly how much material has been removed and how much has been placed — across the entire site, not just on designated stockpiles. The same analysis can also answer a simpler question within a single survey: does the volume of material that would be cut from one area match or exceed the volume needed to fill a depression, culvert, or planned excavation elsewhere on site? The drone captures the pre-extraction surface, then captures the post-extraction surface, and the processing software computes the difference. The result is a net volume change map showing exactly where material has moved, how much has been extracted from each bench or cell, and where fill has been placed.
What do I get in a cut and fill report?
A typical cut and fill report includes a colour-coded change map showing where material has been removed and placed across the site, net volume statements per zone, and a tabulated breakdown by bench, cell, or designated area.
The report can also include a comparison against the planned extraction sequence, so you can verify that extraction is proceeding to plan and identify areas where actual removal rates differ from the schedule.
More about cut and fill analysisCan a cut and fill analysis tell me if material from one area will fill another?
Yes. Within a single survey, a cut and fill analysis can compare two defined zones — for example, a hillock on one side of the site and a culvert on the other — and calculate the net volume difference between them. If the cut volume from the hillock equals or exceeds the fill volume required for the culvert, you know no imported material is needed.
If the fill volume exceeds the cut, the report tells you exactly how much material must be brought in. This is particularly useful for earthworks planning: levelling ground for a new road, preparing a foundation pad, or recontouring land after extraction.
More about cut and fill analysis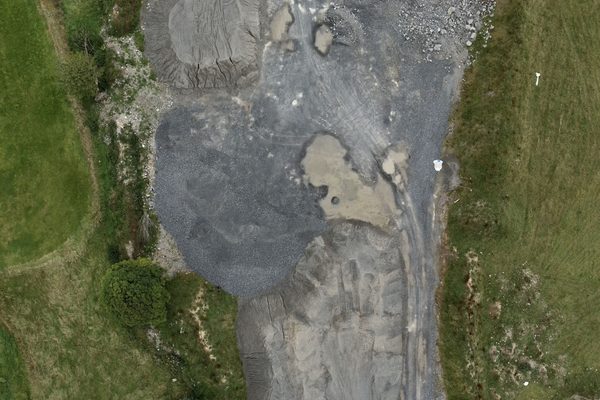
An orthomosaic is a geometrically corrected, high-resolution aerial image of the entire site — stitched together from hundreds of overlapping drone photographs and corrected so that the scale is uniform across the whole image. Unlike a single aerial photograph or a satellite image, an orthomosaic can be used to measure true distances, areas, and feature positions directly. For quarry and landfill operators, this provides a single, current visual reference for site planning, extraction sequencing, blast design, and regulatory submissions.
What can an orthomosaic be used for on a quarry site?
Orthomosaics are used for site planning and layout, extraction sequencing, blast pattern design, haul road planning, drainage assessment, and as a visual baseline record for regulatory submissions. Because the scale is uniform, you can measure bench widths, face heights, and standoff distances directly from the image.
When captured at regular intervals, orthomosaics provide a visual timeline of site development that is useful for stakeholder reporting, planning applications, and compliance documentation.
More about 3D mapping and orthomosaic production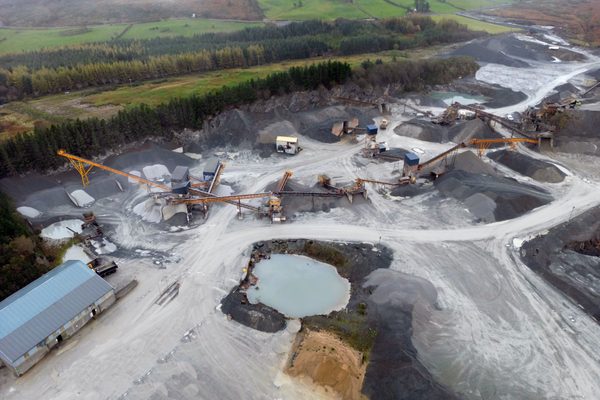
A LiDAR survey captures millions of survey-grade measurements in a single flight, producing a 3D record of your site that can be measured, sectioned, and compared without anyone walking the ground. For quarry and landfill operators, that means stockpile volumes calculated from data rather than estimates, cut and fill quantities you can take to a contractor, and a digital baseline you can compare against future surveys to track exactly how the site is changing over time.
What is the difference between a DSM and a DTM?
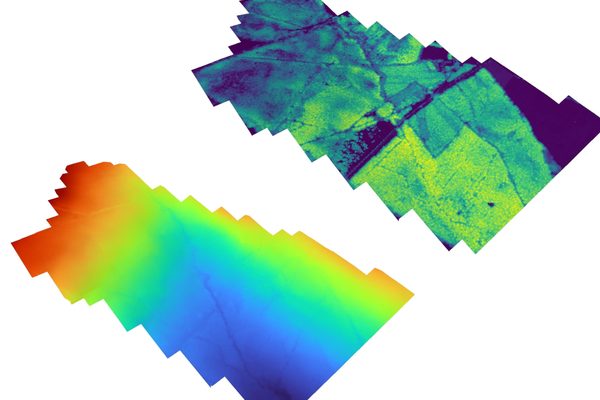
A digital surface model (DSM) includes everything on the ground — stockpiles, trees, buildings, vehicles. A digital terrain model (DTM) represents the bare earth with all surface features removed. The two models are generated from the same LiDAR point cloud: the DSM is the first return (what the laser hits first), and the DTM is produced by classifying and filtering out non-ground points.
The practical value is in the comparison. Subtracting the DTM from the DSM over a stockpile area gives the pile’s volume directly. For a quarry, the DTM reveals the underlying topography for planning the next phase of extraction. For a landfill, comparing the current DSM against the original DTM shows exactly how much airspace has been consumed.
More about 3D mapping and LiDAR surveysWhat does an elevation heatmap tell me that a photograph does not?
A photograph can be misleading. Shadows, vegetation, and lighting conditions can hide slope angles and elevation changes. An elevation heatmap replaces colour with absolute height data — every pixel has a known Z-value — so slopes, depressions, and drainage paths are unambiguous.
For quarry and landfill sites, this is particularly useful for assessing bench stability, planning haul roads at safe gradients, and identifying low points where water will pool after heavy rainfall. The heatmap turns topography into a measurable dataset rather than something interpreted by eye.
Discuss how LiDAR surveying could work for your site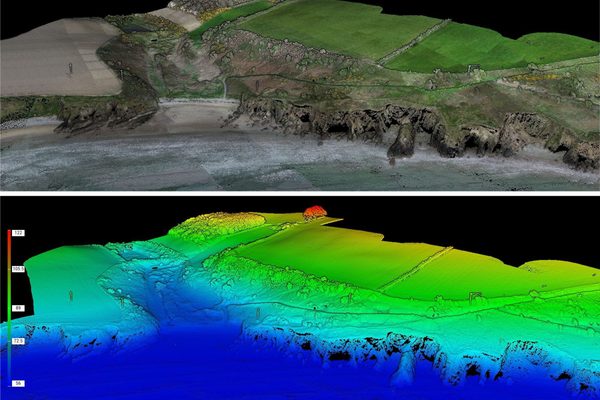
Landfill operators need to know exactly how much airspace remains, where it is, and how quickly it is being consumed. A drone survey produces a current topographic surface of the landfill, which is compared against the permitted final landform to calculate remaining void space. The same survey captures the active cell, the waste reception area, and any temporary stockpiles of daily cover material — giving you a single, current picture of site capacity.
How is remaining landfill airspace calculated?
The current topographic surface captured by the drone is compared against the permitted final restoration contour in 3D processing software. The volume between the two surfaces is the remaining airspace. This calculation can be broken down by cell, by phase, or by waste type if required.
Regular surveys allow the operator to track the fill rate and project the remaining site life with greater confidence than periodic ground-based surveys can provide.
Discuss landfill airspace surveying for your siteCan a drone detect heat spots in a landfill?
Yes. A thermal imaging camera can be carried on the same flight that captures the topographic survey data or on a separate dedicated flight. Thermal imagery can identify elevated surface temperatures that may indicate subsurface heating before it becomes a visible problem, allowing timely intervention.
More about thermal imaging surveys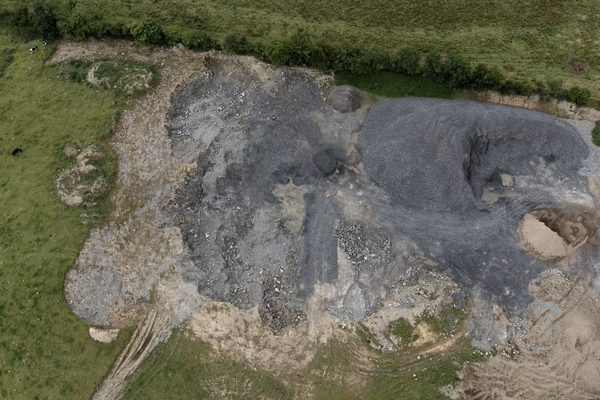
A drone captures the full stockpile surface from the air — no surveyor walking loose material, no risk of slips or collapses, no working near operating plant.
A ground surveyor captures a few hundred points across a stockpile and interpolates the rest. A drone captures millions of points, producing a far more representative surface model for volume calculation.
The drone follows the same pre-programmed flight path every survey — same altitude, same overlap, same coverage. Results from one survey date are directly comparable to the next without the variability introduced by different surveyors or methods.
Extraction, processing, and tipping continue below while the drone captures data overhead. No vehicles need to be moved, no areas need to be cordoned off, and the survey is typically completed in under a day.
Volume statements, topographic change maps, and orthomosaic records are delivered in formats suitable for resource reporting, EPA submissions, financial audits, and planning compliance.
Conventional stockpile volume measurement requires a surveyor to walk the full surface of each pile with a GPS rover — climbing loose material, working adjacent to operating plant, and capturing a few hundred points to represent what is often thousands of tonnes of material. A drone survey captures the entire surface from the air in a single automated flight, producing millions of data points and a volume calculation that typically falls within a few percent of true volume.
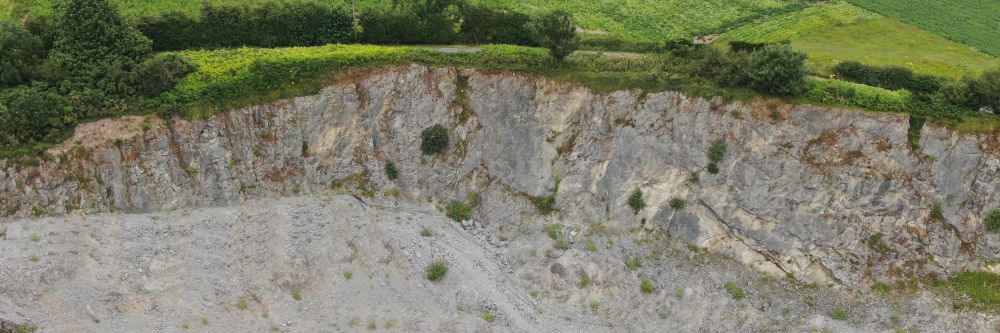
When extraction rates, fill progress, and remaining capacity are measured using ground-based methods, the results depend on which surveyor walked which path on which day. A drone follows the identical flight plan every time — same altitude, same overlap, same coverage — so the only thing that changes between surveys is the surface. Cut and fill maps, volume change statements, and airspace projections become directly comparable between dates, giving you a reliable picture of how the site is evolving.
For quarry managers reporting extraction volumes and landfill operators projecting remaining site life, this consistency turns survey data from a periodic estimate into a dependable operational tool.
Tell us what you need to know, and we will work with you to design survey deliverables that give you the outcomes you need. Whether you require quarterly volume audits, pre- and post-blast face mapping, landfill airspace tracking, or a one-off topographic survey, the approach is designed around your site and your reporting requirements — not a fixed product off the shelf.
A typical survey delivers stockpile volume calculations in cubic metres with an accuracy statement, a colour-coded cut and fill change map comparing the current survey against the previous date, an orthomosaic site map suitable for planning and regulatory submissions, and a topographic surface model that can be supplied in formats compatible with your existing mine planning or GIS software.
For landfill operators, the same deliverables set is supplemented with remaining airspace calculations against the permitted final landform and, where useful, a fill rate projection based on the recorded consumption rate between survey dates.
Volume statements per stockpile in cubic metres, with an accuracy assessment — suitable for inventory, financial, and contractual use.
A geometrically corrected, high-resolution aerial image of the full site — measure true distances and areas directly from the map.
Colour-coded map showing exactly where material has been extracted and placed between survey dates, with net volume statements per zone.
A digital terrain model of the current site surface, supplied in formats compatible with mine planning and GIS software.
Complex surveys and inspections require more than just a pilot. Our engineers can help you scope your requirements and indentify the right approach.