Cut and fill analysis
Measure cut and fill volumes across a site as the earthworks progress — calculated from a full-site surface model, without interrupting active works.
Measure cut and fill volumes across a site as the earthworks progress — calculated from a full-site surface model, without interrupting active works.
Cut and fill is the process of reshaping ground to a design profile: material is removed from high points and placed into low points. On an earthworks project the aim is normally to balance the two, so that as little material as possible has to be imported from elsewhere or taken off site as spoil.
A drone survey measures that movement from the ground itself. A baseline survey is flown before work begins, repeat surveys follow at agreed intervals, and the volume difference between dates gives the cut and fill figures — site-wide, and without surveyors walking an active earthworks site.
What is the difference between cut and fill?
Cut is material removed to bring ground down to design level; fill is material placed to bring it up. A cut and fill analysis reports both across a site, and the ratio between them, so you can see whether the site is in net cut or net fill at any stage of the programme.
More about earthworks and extractive surveysWhy does an accurate cut and fill figure matter?
Earthworks miscalculations are among the most common causes of cost overruns on civil engineering projects. Over-excavation generates excess spoil and disposal costs; under-excavation delays the works that follow. Inaccurate fill tracking can lead to compaction failures and settlement later.
Discuss cut and fill analysis for your projectHow is a cut and fill analysis calculated?
Photogrammetric processing produces a digital terrain model for each survey date. Comparing the terrain models — the bare earth, not the vegetation and surface clutter on top of it — gives the true volume of earth moved between them.
More about LiDAR and terrain modellingHow accurate is the volume figure?
On hardstanding and worked ground, a drone survey with ground control can typically achieve around 2 cm accuracy. The advantage over ground methods is coverage as well as precision: the volume is calculated from millions of points across the full site rather than from sampled points.
Every survey is delivered with an accuracy statement, so the figures can be used with confidence for payment, planning, and reporting.
More about drone survey accuracyIs this the same as stockpile volume measurement?
No. Stockpile volume measurement quantifies the material sitting in piles on a site; cut and fill analysis compares the ground surface between survey dates to measure excavation and placement. Both rely on the same surface-comparison method, but they answer different questions.
More about stockpile volume measurement







Just call us, and we'll help you.
The volume of material excavated across the site — reported by zone, by stage, or as a site-wide total.
The volume of material placed or compacted, tracked against the design profile.
Whether the site is in net cut or net fill at any point in the earthworks programme.
How much material has moved in total between survey dates, so progress can be measured against programme.
A current ground surface for each survey date, so the state of the earthworks is documented as the programme progresses.
How much material must be taken off site as spoil, or brought in to complete the fill.
At its core, cut and fill analysis is the comparison of two digital terrain surfaces. The drone captures a survey-grade 3D model of the site before work begins. After excavation, grading, or filling, a second survey captures the new surface. The processing software overlays the two models and calculates the volume difference at every point on the grid — producing a colour-coded map that shows exactly where material has been removed and where it has been placed.
What is the difference between a DSM and a DTM, and why does it matter for earthworks?
A digital surface model (DSM) includes everything on the ground — stockpiles, vegetation, buildings, machinery. A digital terrain model (DTM) represents the bare earth with all surface features removed. Both are generated from the same survey data: the DSM captures what the drone sees, and the DTM is produced by classifying and filtering out non-ground points.
For earthworks, the distinction is critical. If you compare a pre-construction DSM (with trees and undergrowth) against a post-excavation DSM (bare soil), the volume difference includes the vegetation you cleared — not just the soil you moved. Comparing DTM against DTM gives you the true cut and fill volumes of the earth itself, which is what your quantity surveyor and contractor need for payment and planning.
More about LiDAR and terrain modellingWhat does an elevation heatmap tell me that a site photograph does not?
A site photograph can be misleading. Shadows, vegetation, and lighting conditions can hide slope angles and elevation changes. An elevation heatmap replaces colour with absolute height data — every pixel has a known Z-value — so slopes, depressions, and drainage paths are unambiguous.
For earthworks planning, this is particularly useful for identifying the natural drainage corridors before you move any material, verifying that finished gradients meet design specifications, and locating low points where water will pool after grading. The heatmap turns topography into a measurable dataset rather than something interpreted by eye from a photograph.
Discuss cut and fill analysis for your project
Earthworks are measured against a baseline. A survey is flown before work begins, or at any agreed reference stage, and repeat surveys follow at agreed intervals. Because each survey is processed to the same digital terrain model, the volume difference between any two dates is the amount of material that has been cut or placed between them — so progress can be measured against the programme rather than only at a few fixed checkpoints.
How often should a site be surveyed during earthworks?
As often as progress needs to be evidenced — commonly monthly, or tied to measurement and payment milestones. Because the flight path and processing are consistent, each survey is directly comparable with the last, which is what makes a volume difference between two dates meaningful.
More about LiDAR and terrain modelling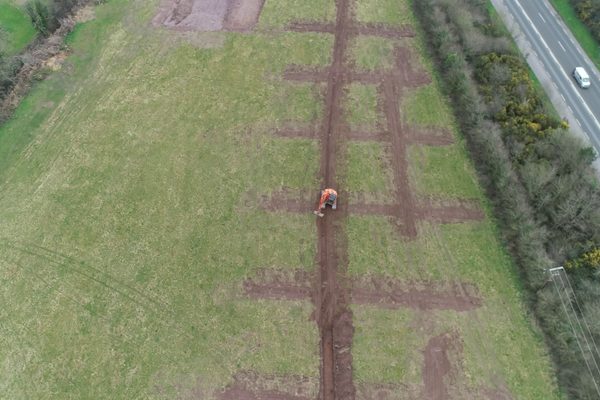
The analysis also answers the balance question: does the material cut from one area equal or exceed the fill required elsewhere on site? Where it does, no imported material is needed. Where it does not, the shortfall is quantified. Where there is a surplus, the volume to be taken off site as spoil is known before any haulage is arranged.
Can material cut from one area be used to fill another?
Yes. Within a single survey, the analysis can compare two defined zones and calculate the net volume difference between them. If the cut volume equals or exceeds the fill required, no imported material is needed; if the fill exceeds the cut, the report states exactly how much has to be brought in.
See how quarries and landfills use this analysis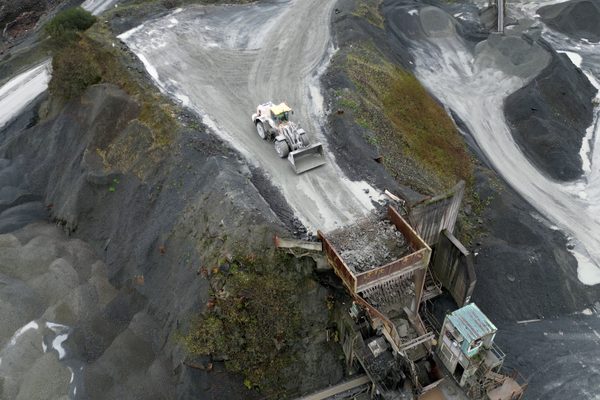
The survey is captured from the air, so nobody has to walk an earthworks site alongside moving plant to collect points by hand.
A ground survey recovers a relatively small number of points and interpolates between them. A drone survey can capture millions, producing a far more complete surface for volume calculation.
Each survey is compared with the previous date, so earthworks volumes can be tracked through the programme rather than only at fixed survey intervals.
Compare cut and fill volumes across a site to see how much material can be matched on site, and how much must be imported or removed as spoil.
The drone operates above the working area. Excavation, grading, and filling can typically continue while the data is captured.
Every survey is delivered with a documented accuracy statement, so the volumes can be used with confidence for payment, planning, and reporting.
From motorway-scale earthworks and site levelling to housing foundations, driveways, and land shaping.
Tell us what you need to know, and we will work with you to design survey deliverables that give you the outcomes you need — progress volumes for the site engineer, a change map for the design team, or a measured figure for payment.
A typical cut and fill survey delivers a colour-coded change map showing where material has been removed and placed, net volume statements per zone, and a digital terrain model for each survey date — supplied in formats compatible with your CAD or GIS software.
Cut and fill volumes reported by zone or by stage, with an accuracy statement.
A map showing exactly where material has been removed and where it has been placed between survey dates.
A terrain model for each survey date, supplied in formats compatible with CAD and GIS software.
A written report with the figures, the method used, and the documented accuracy of each survey.
Complex surveys and inspections require more than just a pilot. Our engineers can help you scope your requirements and indentify the right approach.