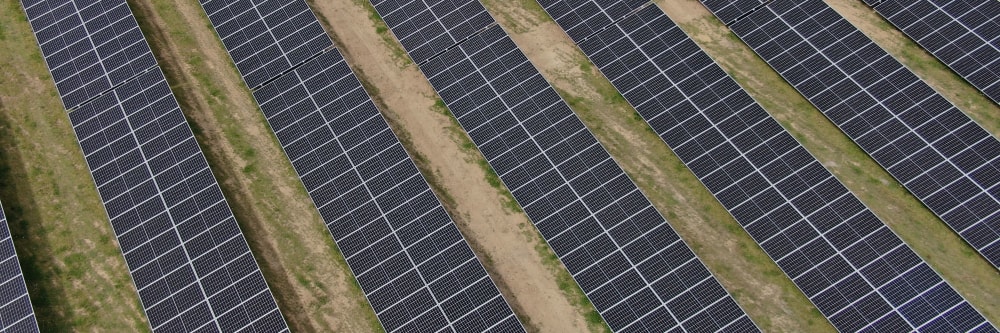
A large utility-scale solar farm may have tens of thousands of panels — a ground inspection team can take weeks to survey the full site manually, and many faults are invisible to the naked eye. Our thermal drone surveys can cover the entire site in a single sortie, without removing or de-energising a single panel. Every fault — hotspot, bypass diode failure, string underperformance, soiling pattern — is captured in flight and delivered as a georeferenced, annotated fault map your maintenance team can act on directly.
Why use a drone instead of a ground inspection team?
Without drone technology, a ground team would need to cover panels one by one, walking the rows. In that scenario, a large utility-scale site could take weeks to survey manually, and faults invisible to the naked eye would likely be missed. A drone surveys every panel in a single automated flight, capturing thermal and high-resolution visual data simultaneously, and every fault is GPS-tagged at the point of capture.
The output is not a clipboard of handwritten notes. It is a georeferenced thermal orthomosaic with every fault located and classified, ready for your maintenance team to act on directly. No panel is skipped. No row is missed. And there is no downtime — the array stays live throughout.
More about drone surveying versus manual inspectionDoes the solar farm need to be de-energised during the inspection?
No. The array stays live throughout the inspection. This is not just convenient — it is operationally necessary, because thermal faults are only visible when panels are at operating temperature. A panel that has been de-energised and cooled down will not show the heat differential that reveals a failing cell, a bypass diode issue, or an underperforming string.
The drone flies above the array at a standoff distance that requires no physical contact with any panel. No panels are removed, tilted, or shut down. Generation continues uninterrupted throughout the survey.
More about thermal imaging inspectionsIs drone inspection suitable for any size of solar farm?
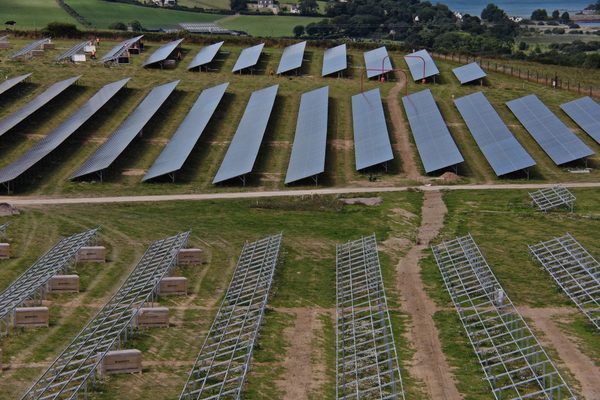
Drone surveys work across the full range of solar installations. A utility-scale farm with tens of thousands of panels is covered in a single automated sortie. A modest commercial rooftop array of a few hundred panels is surveyed in minutes. The drone's flight path is planned to the dimensions of the site, so the method scales up or down without changing the core workflow.
For very small installations — a single domestic array, for example — a drone survey may not be the most cost-effective approach. But for any commercial or utility-scale solar farm where systematic coverage, GPS-tagged fault records, and a structured deliverable matter, drone inspection is typically the fastest and most thorough option available.
Discuss your site requirementsHotspots, bypass diode failures, and underperforming strings are invisible to the naked eye under normal operating conditions. Our drones carry thermal imaging cameras that detect heat anomalies across every panel in a single sortie — identifying failing cells and components before they cause measurable production losses. The thermal survey runs alongside the visual inspection with no additional flight time and no panels removed or de-energised.
What is a thermal imaging or thermography survey?
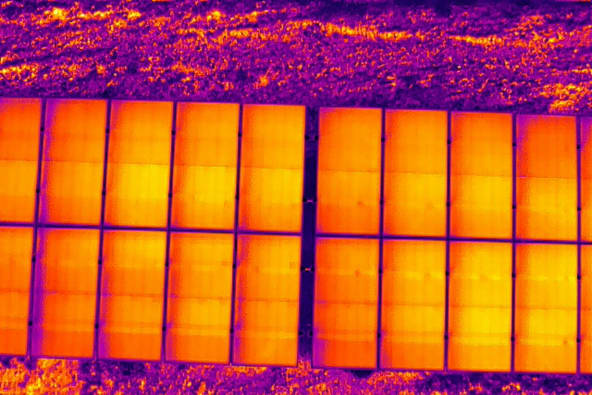
On a solar farm, thermal imaging detects faults that are invisible to the naked eye under normal operating conditions. A healthy solar cell converts sunlight into electricity. A faulty cell — whether cracked, delaminated, or affected by potential-induced degradation (PID) — does not convert that energy. It absorbs it as heat instead. That cell runs measurably hotter than its neighbours, and that temperature difference is what the thermal camera sees.
Different faults produce different thermal signatures. A single bright cell in an otherwise uniform panel suggests a cracked cell, localised shading, or physical damage. An entire string of cells running warmer than the rest of the array indicates string underperformance. A warm, uniform rectangular patch extending across a panel typically points to an activated or failed bypass diode, while irregular warm patches at the edges can indicate delamination. In each case, what the camera records is the heat differential — the contrast between a healthy panel and one that is absorbing energy rather than converting it. The drone captures every panel on the site in a single sortie — no panels removed, no array de-energised, and no ground team walking the rows.
More about our thermal imaging servicesWhat types of fault can a thermal drone detect on a solar panel?
A thermal camera can detect hotspots caused by cracked or delaminated cells, activated or failed bypass diodes, underperforming strings, and potential-induced degradation (PID). Each fault type produces a recognisable thermal signature: a single bright cell suggests a crack, a warm rectangular patch points to a bypass diode issue, and an entire string running warmer than its neighbours indicates string-level underperformance.
The key point is that these faults are invisible to the naked eye under normal operating conditions. A panel that looks perfectly normal in a visual inspection can be losing measurable output — and the thermal camera sees the heat differential that reveals it.
More about thermal imaging for solar farms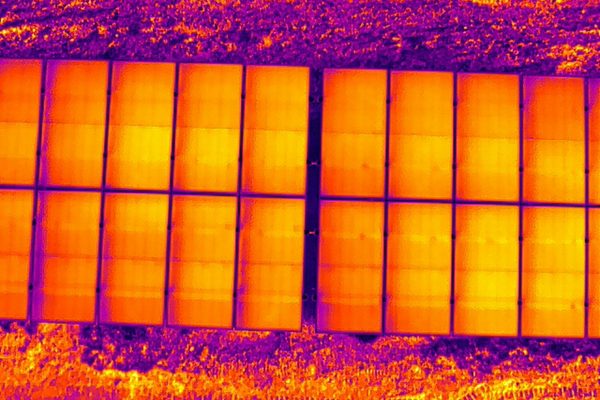
A large utility-scale solar farm may have tens of thousands of panels. A ground inspection team covering the same site manually can take weeks. Our drones survey the full array in a single flight, capturing thermal and high-resolution visual data simultaneously — with no downtime, no scaffolding, and no interruption to generation.
How long does a drone inspection of a solar farm take?
For a typical utility-scale solar farm, the on-site flight can be completed in a single day. The drone follows a pre-planned automated flight path that ensures every panel is captured from the correct angle and altitude, with thermal and visual imagery recorded simultaneously. Post-flight processing — stitching the imagery into a georeferenced orthomosaic and producing the annotated fault map — typically takes a few working days.
The comparison that matters is not flight time versus flight time. It is that a ground team covering the same site manually can take weeks, with panels needing to be checked one by one. A drone covers every panel in a single sortie with no downtime and no interruption to generation.
More about our drone survey approach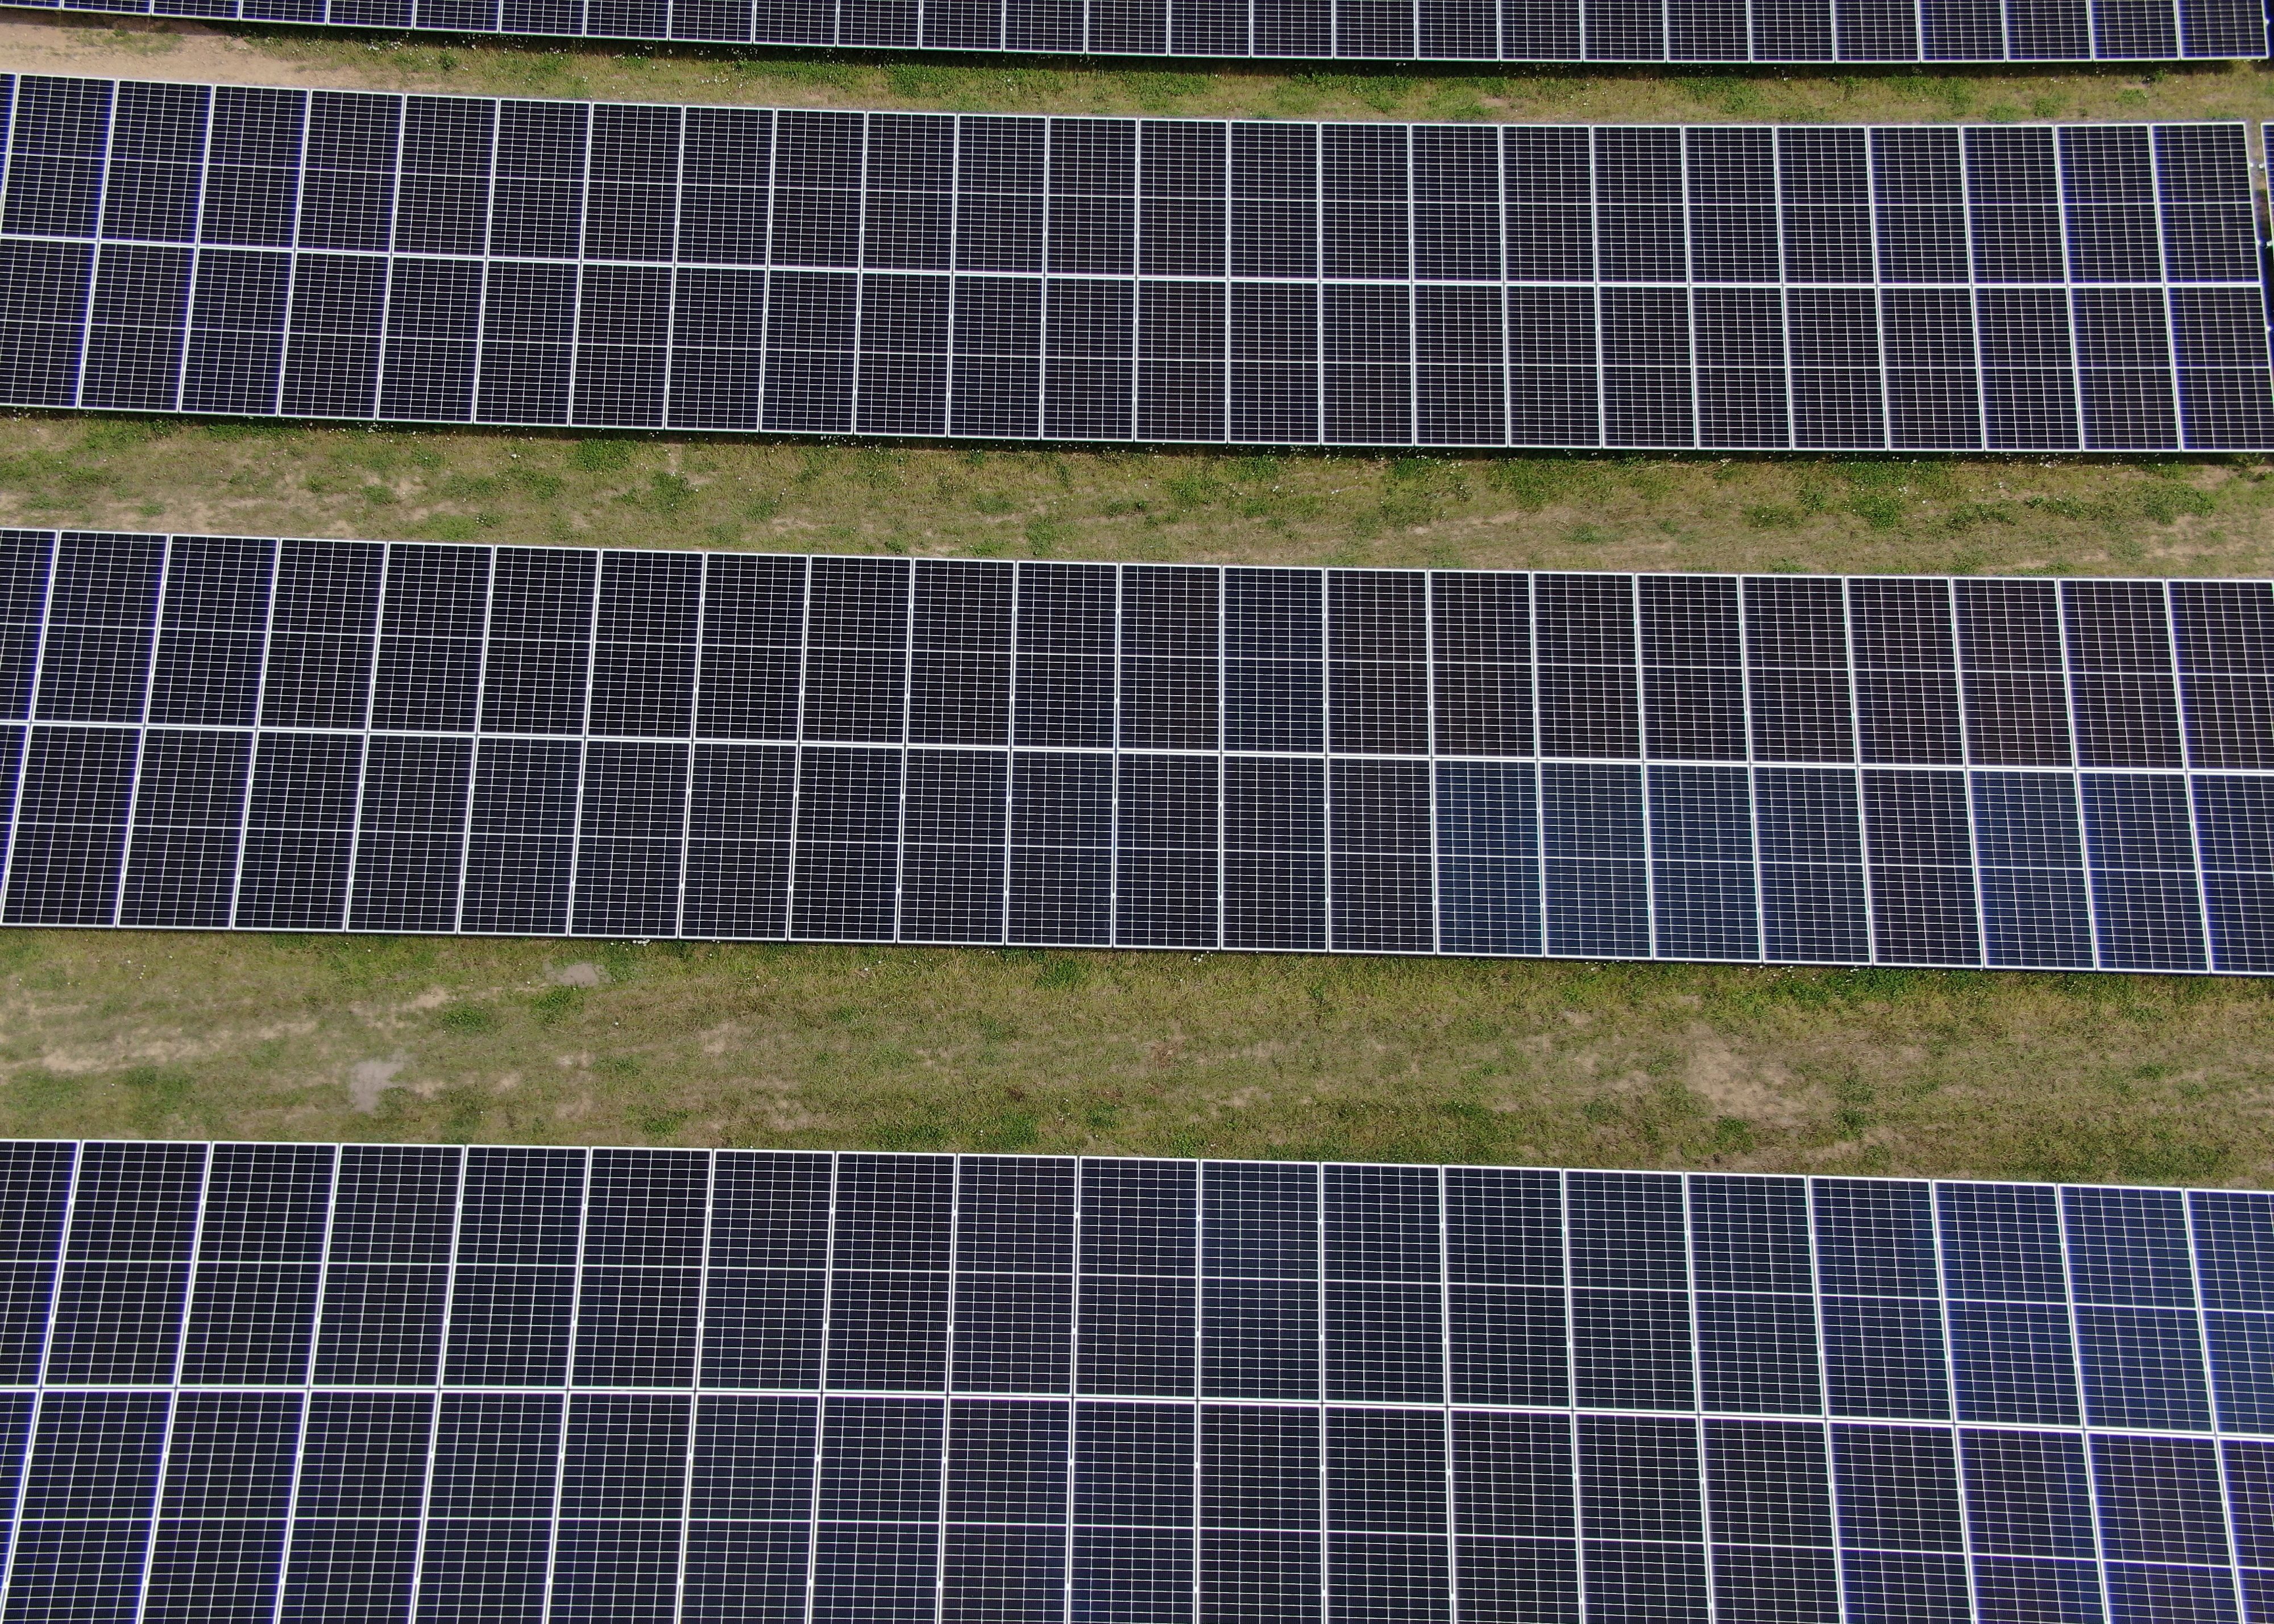
Every fault is GPS-tagged at the point of capture and referenced on a full-site orthomosaic. The output is a panel-level annotated fault map — your maintenance team can locate any identified fault in the field without guesswork. The same dataset provides a timestamped baseline record of your array’s condition for performance monitoring, warranty claims, and insurance purposes.
What are orthophotos and orthomosaics?
An orthophoto is an aerial image that has been geometrically corrected so that every pixel represents a true top-down view, free from the perspective distortion of a regular photograph. Unlike a standard aerial photo, you can measure true distances on an orthophoto: the distance between two panels, the area of a section of the array, the coordinates of a specific fault. When multiple orthophotos are stitched together to cover an entire site, the result is an orthomosaic. These can be huge and incredibly detailed: a single orthomosaic of a utility-scale solar farm can be hundreds of megapixels in size, with every panel visible and every fault located to within centimetres.
For a solar farm, the orthomosaic is the foundation deliverable. Every panel is accurately positioned, every defect is located by GPS coordinates, and the image can be loaded directly into CAD, GIS, or asset management software. It is the difference between “here is a photograph of your site” and “here is a measurable, georeferenced map of your site.”
More about drone surveying and orthomosaic deliverablesHow can drone inspection data support a warranty claim?
Panel manufacturers typically warrant their modules for 25 years, but a warranty claim requires evidence. A thermal drone survey produces a timestamped, georeferenced dataset that records the condition of every panel on a specific date — each fault GPS-tagged, each thermal anomaly captured and classified. That dataset is an objective baseline: if a string of panels degrades below the warranted performance threshold, the before-and-after evidence is already in place.
Discuss your inspection requirements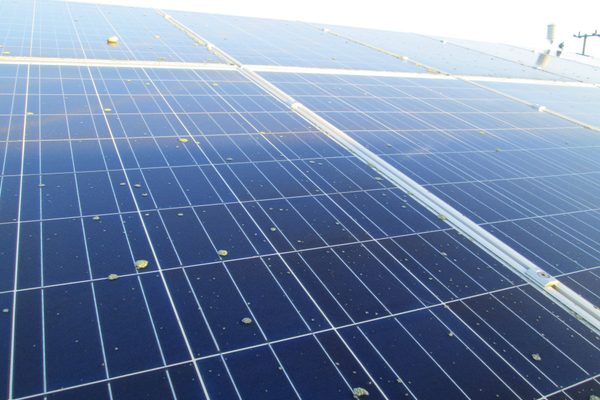
Before a solar farm can be designed, developers need accurate topographic and photographic data of the proposed site. This feeds directly into specialist solar design CAD software for panel placement, shading analysis, sun angles by season, and site suitability assessment. We produce a survey-grade orthomosaic, Digital Elevation Model, and Digital Surface Model in a single flight — with all site features (trees, hedgerows, walls, buildings, watercourses) captured and positioned to survey accuracy.
What is photogrammetry?
Photogrammetry is the process of using multiple overlapping aerial photographs, taken from slightly different angles, to produce accurate 2D maps and 3D models of the ground below. Software identifies the same point on the ground across dozens of images and triangulates its true position in three-dimensional space. The result is a survey-grade orthomosaic, a Digital Elevation Model showing bare-earth terrain, and a Digital Surface Model that includes buildings, hedgerows, and vegetation.
For solar developers, photogrammetry is the survey method that feeds directly into specialist solar design CAD software. One flight delivers the orthophoto, the elevation data, and the site-feature mapping that a designer needs to assess terrain suitability, model panel placement, and run shading analysis across the full site.
More about our drone survey servicesWhat is the difference between a Digital Elevation Model and a Digital Surface Model?
A Digital Elevation Model (DEM) represents the bare ground with all surface features — trees, buildings, hedgerows — digitally removed. It shows the shape of the terrain itself, and is what a solar designer needs to assess slope, aspect, and drainage across the site. A Digital Surface Model (DSM) includes all surface features: buildings, vegetation, walls, and other structures. A designer uses the DSM to model shading from trees and hedgerows across the year.
Both are produced from the same drone flight using photogrammetry. The drone captures overlapping images across the site, and the processing software triangulates every visible point in three-dimensional space — producing the orthomosaic, DEM, and DSM as outputs of the same dataset.
More about drone surveying and photogrammetryWhat does an elevation heatmap tell me that a standard aerial photo does not?
A standard aerial photo can be misleading. Grass, crops, and shadows can hide the true shape of the ground — a gentle slope can look flat, and a drainage depression can disappear under vegetation. An elevation heatmap replaces colour with absolute height data: every pixel has a known Z-value, so slope angles, aspect (which way the ground faces), and natural drainage paths are unambiguous.
For a solar developer, this matters at the feasibility stage. The heatmap reveals whether a site’s slopes face south (good for yield), whether there are depressions where surface water will pool around inverter stations, and whether the natural drainage paths will work with or against the cable trench layout. It turns a site visit into a measurable dataset that feeds directly into PVsyst and solar design CAD.
Discuss pre-construction mapping for your solar site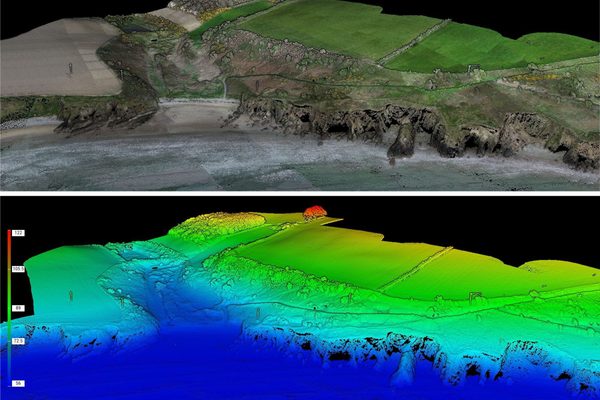
The array stays live throughout the inspection. No panels are removed, tilted, or shut down — which matters because faults are only visible at operating temperature.
Thermal imaging detects hotspots, bypass diode failures, and string faults invisible to the naked eye. Visual RGB captures physical damage. Both run simultaneously in a single sortie with no additional flight time.
Tens of thousands of panels surveyed in a single automated flight — what a ground team might take weeks to cover is completed in a day, with no downtime and no interruption to generation.
Every fault is GPS-tagged at the moment of capture and referenced on a full-site orthomosaic. Your maintenance team can locate any fault in the field without guesswork.
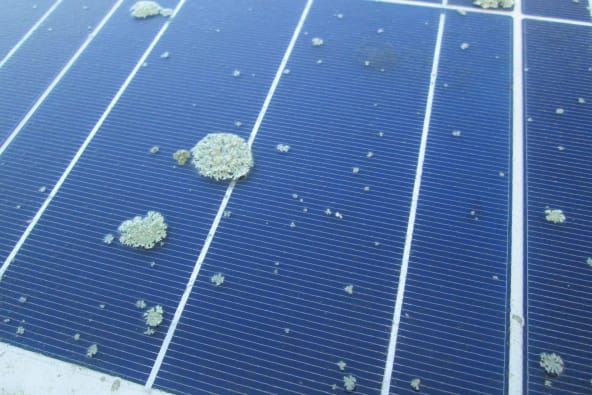
Faults are classified by type and severity — hotspots, bypass diode failures, string faults, soiling, physical damage — giving your team a prioritised maintenance schedule.
Solar developers need accurate topographic and photographic data before design can begin. We produce a survey-grade orthomosaic, DEM, and DSM in a single flight, ready for solar design CAD software.
A large utility-scale solar farm may have tens of thousands of panels. Our drones capture thermal and high-resolution visual data across every panel in a single automated flight — producing a full-site thermal orthomosaic that your maintenance team can use to locate every fault to within centimetres, without a ground crew covering the field.
The delivered thermal orthomosaic and annotated fault map contain panel-level GPS references for every identified fault. Your maintenance team can locate each fault in the field without guesswork. Faults are classified by type and severity — hotspots, bypass diode failures, string faults, soiling, physical damage — giving you a prioritised maintenance schedule. The same georeferenced dataset provides a timestamped baseline record for ongoing performance monitoring, warranty claims, and insurance purposes.
Every inspection delivers a thermal orthomosaic of the full site, an annotated fault map with panel-level GPS references for each identified fault, visual imagery of flagged panels, and a fault classification report — ready to hand directly to your maintenance team, and suitable for warranty claims and insurance purposes.
Solar design CAD software needs both an accurate overhead orthophoto and elevation data before panel placement, shading analysis, or site suitability assessments can begin. Photogrammetry delivers both in a single flight — a survey-grade orthomosaic, Digital Elevation Model, and Digital Surface Model, with all site features (trees, hedgerows, walls, buildings, watercourses) captured and positioned to survey accuracy. We liaise directly with landowners to confirm access, and large rural sites typically operate under Open Category rules with no special permissions required.
Complex surveys and inspections require more than just a pilot. Our engineers can help you scope your requirements and indentify the right approach.