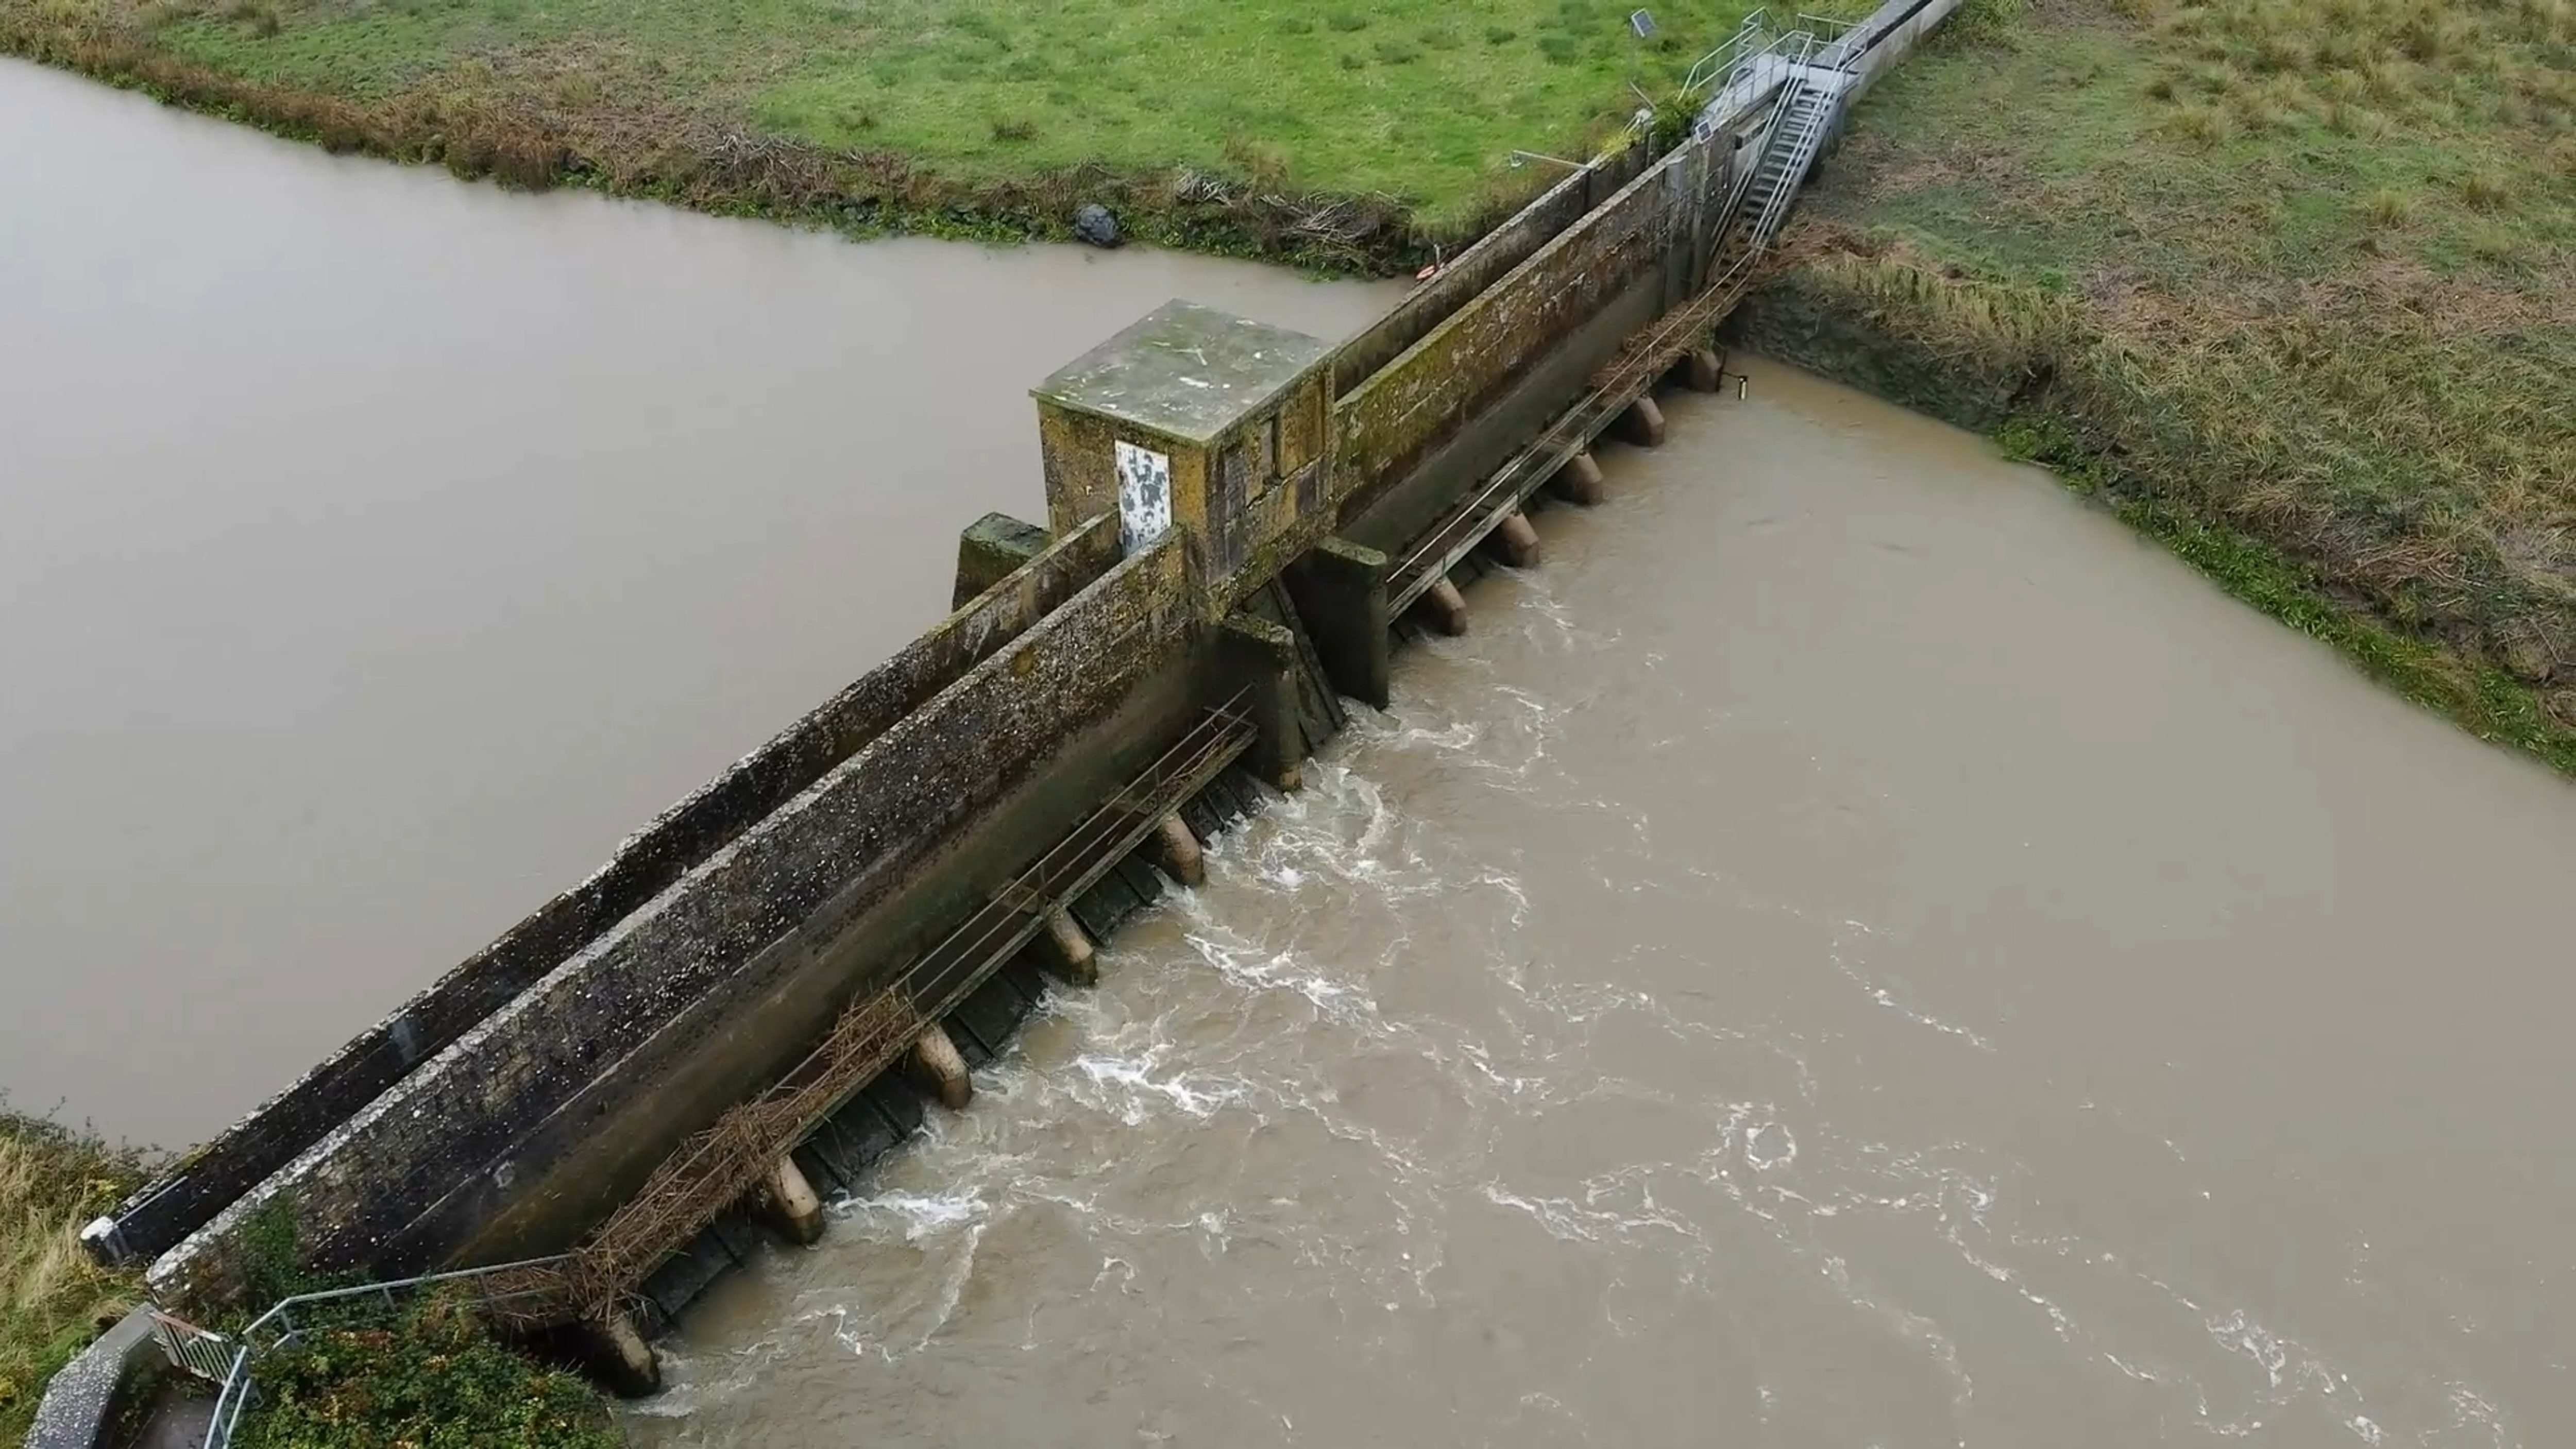
Wide aerial view of the complete barrage structure and surrounding riverbanks

Water dam aerial data collection

County Clare A tidal flood defence barrage on a tributary of the Shannon. 4K video and geotagged imagery captured on the hour, every hour, throughout a full tidal cycle.
Overview

The Job at a Glance

A water management company needed visual data of water flow through a tidal flood defence barrage on a small tributary of the Shannon in County Clare. Engineers With Drones captured 4K video and geotagged still imagery on the hour, every hour, throughout the full tidal cycle - giving the client a complete like-for like record of flow conditions at every stage of the tide.

County Clare

A tidal flood defence barrage on a small tributary of the Shannon, re-entering the Shannon estuary. Accessible by drone without personnel working on or over water.

Full tidal cycle

On the hour, every hour - a full 12-hour tidal cycle captured in a single day. Data collected one hour before high tide, one hour after, and at every stage of the ebb and flow.

4K video + still imagery

High-resolution 4K video and still images captured at each hourly interval, all geotagged for precise location reference.

Complete dataset delivered

All footage and imagery collated into a structured, self-explanatory dataset - ready for the client's engineers to analyse without further interpretation.

Background

A water management company needed to understand how the barrage was performing

The client for this project was a water management company with extensive experience in civil-level water works - hydroelectric dams, flood defences, embankment barriers, and similar infrastructure. They were responsible for a barrage (a flood defence dam) located on a small tributary of the Shannon in County Clare, near where the river re-enters the Shannon estuary. Because the area is tidal, the barrage's behaviour changes constantly with the rising and falling tide. The client needed to understand exactly how water flowed through the structure at every stage of that cycle - one hour before high tide, one hour after, two hours, three hours, and so on - so they could assess whether the barrage was operating as intended.

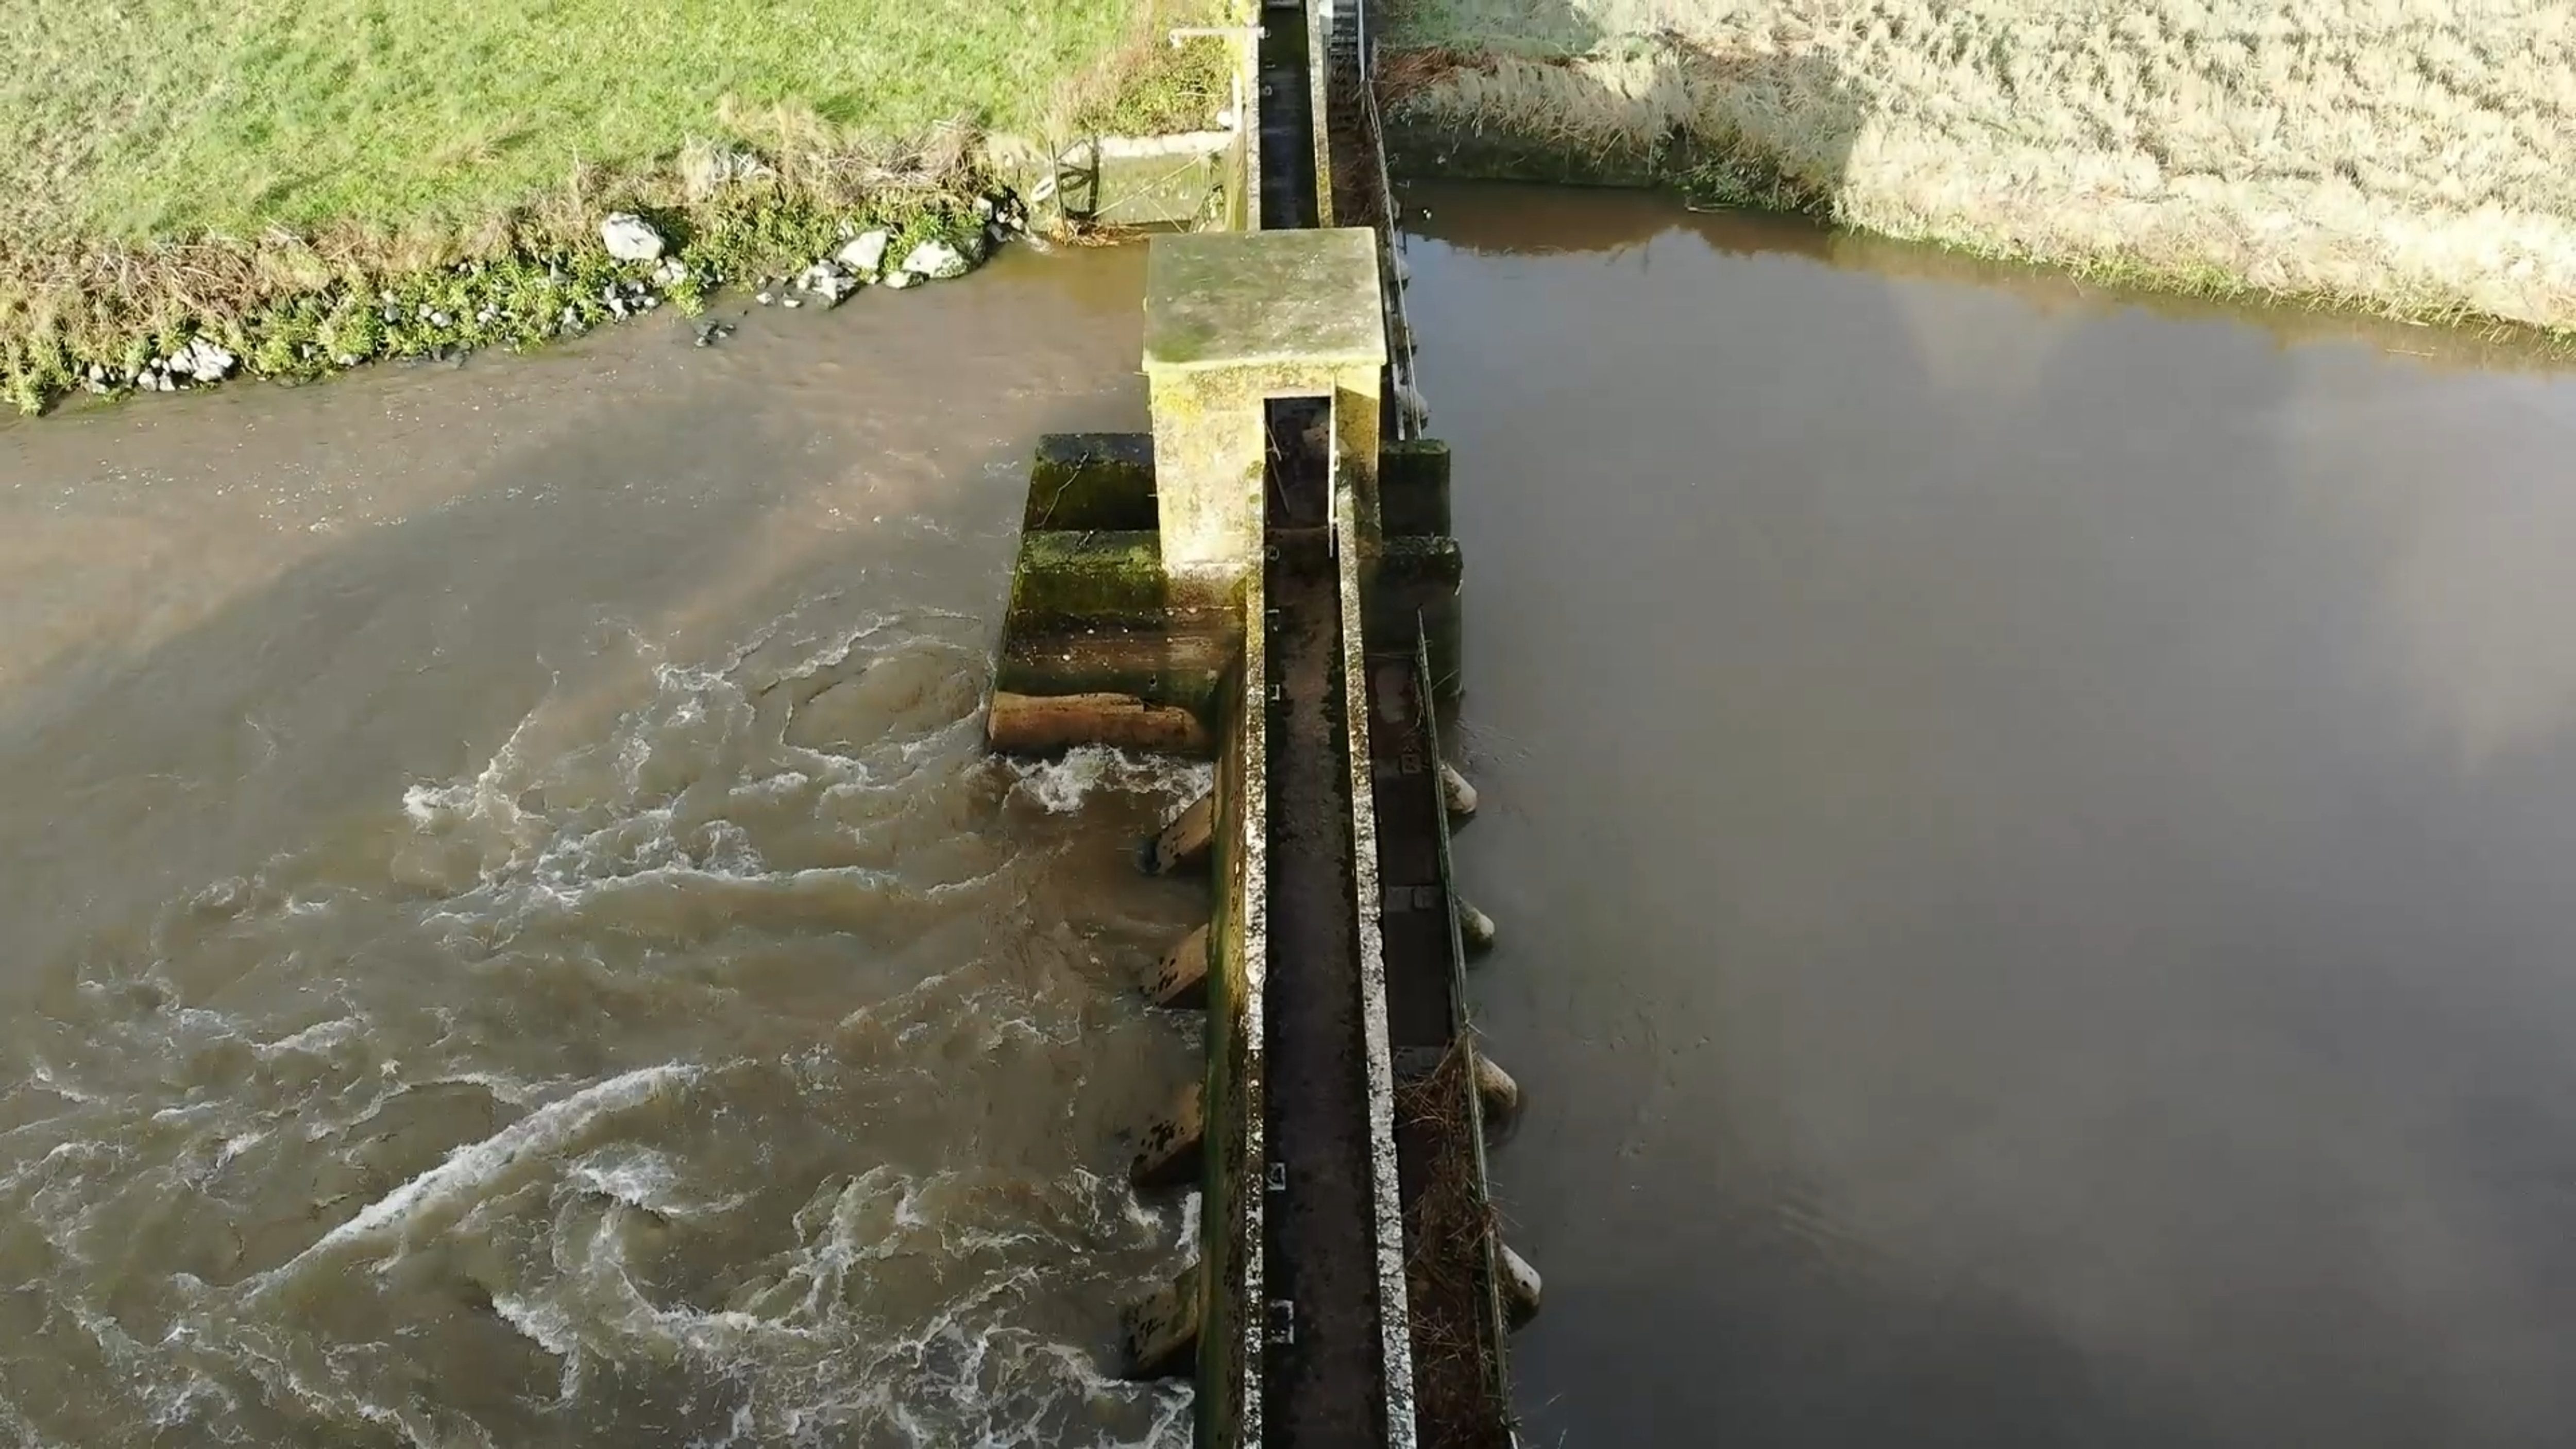
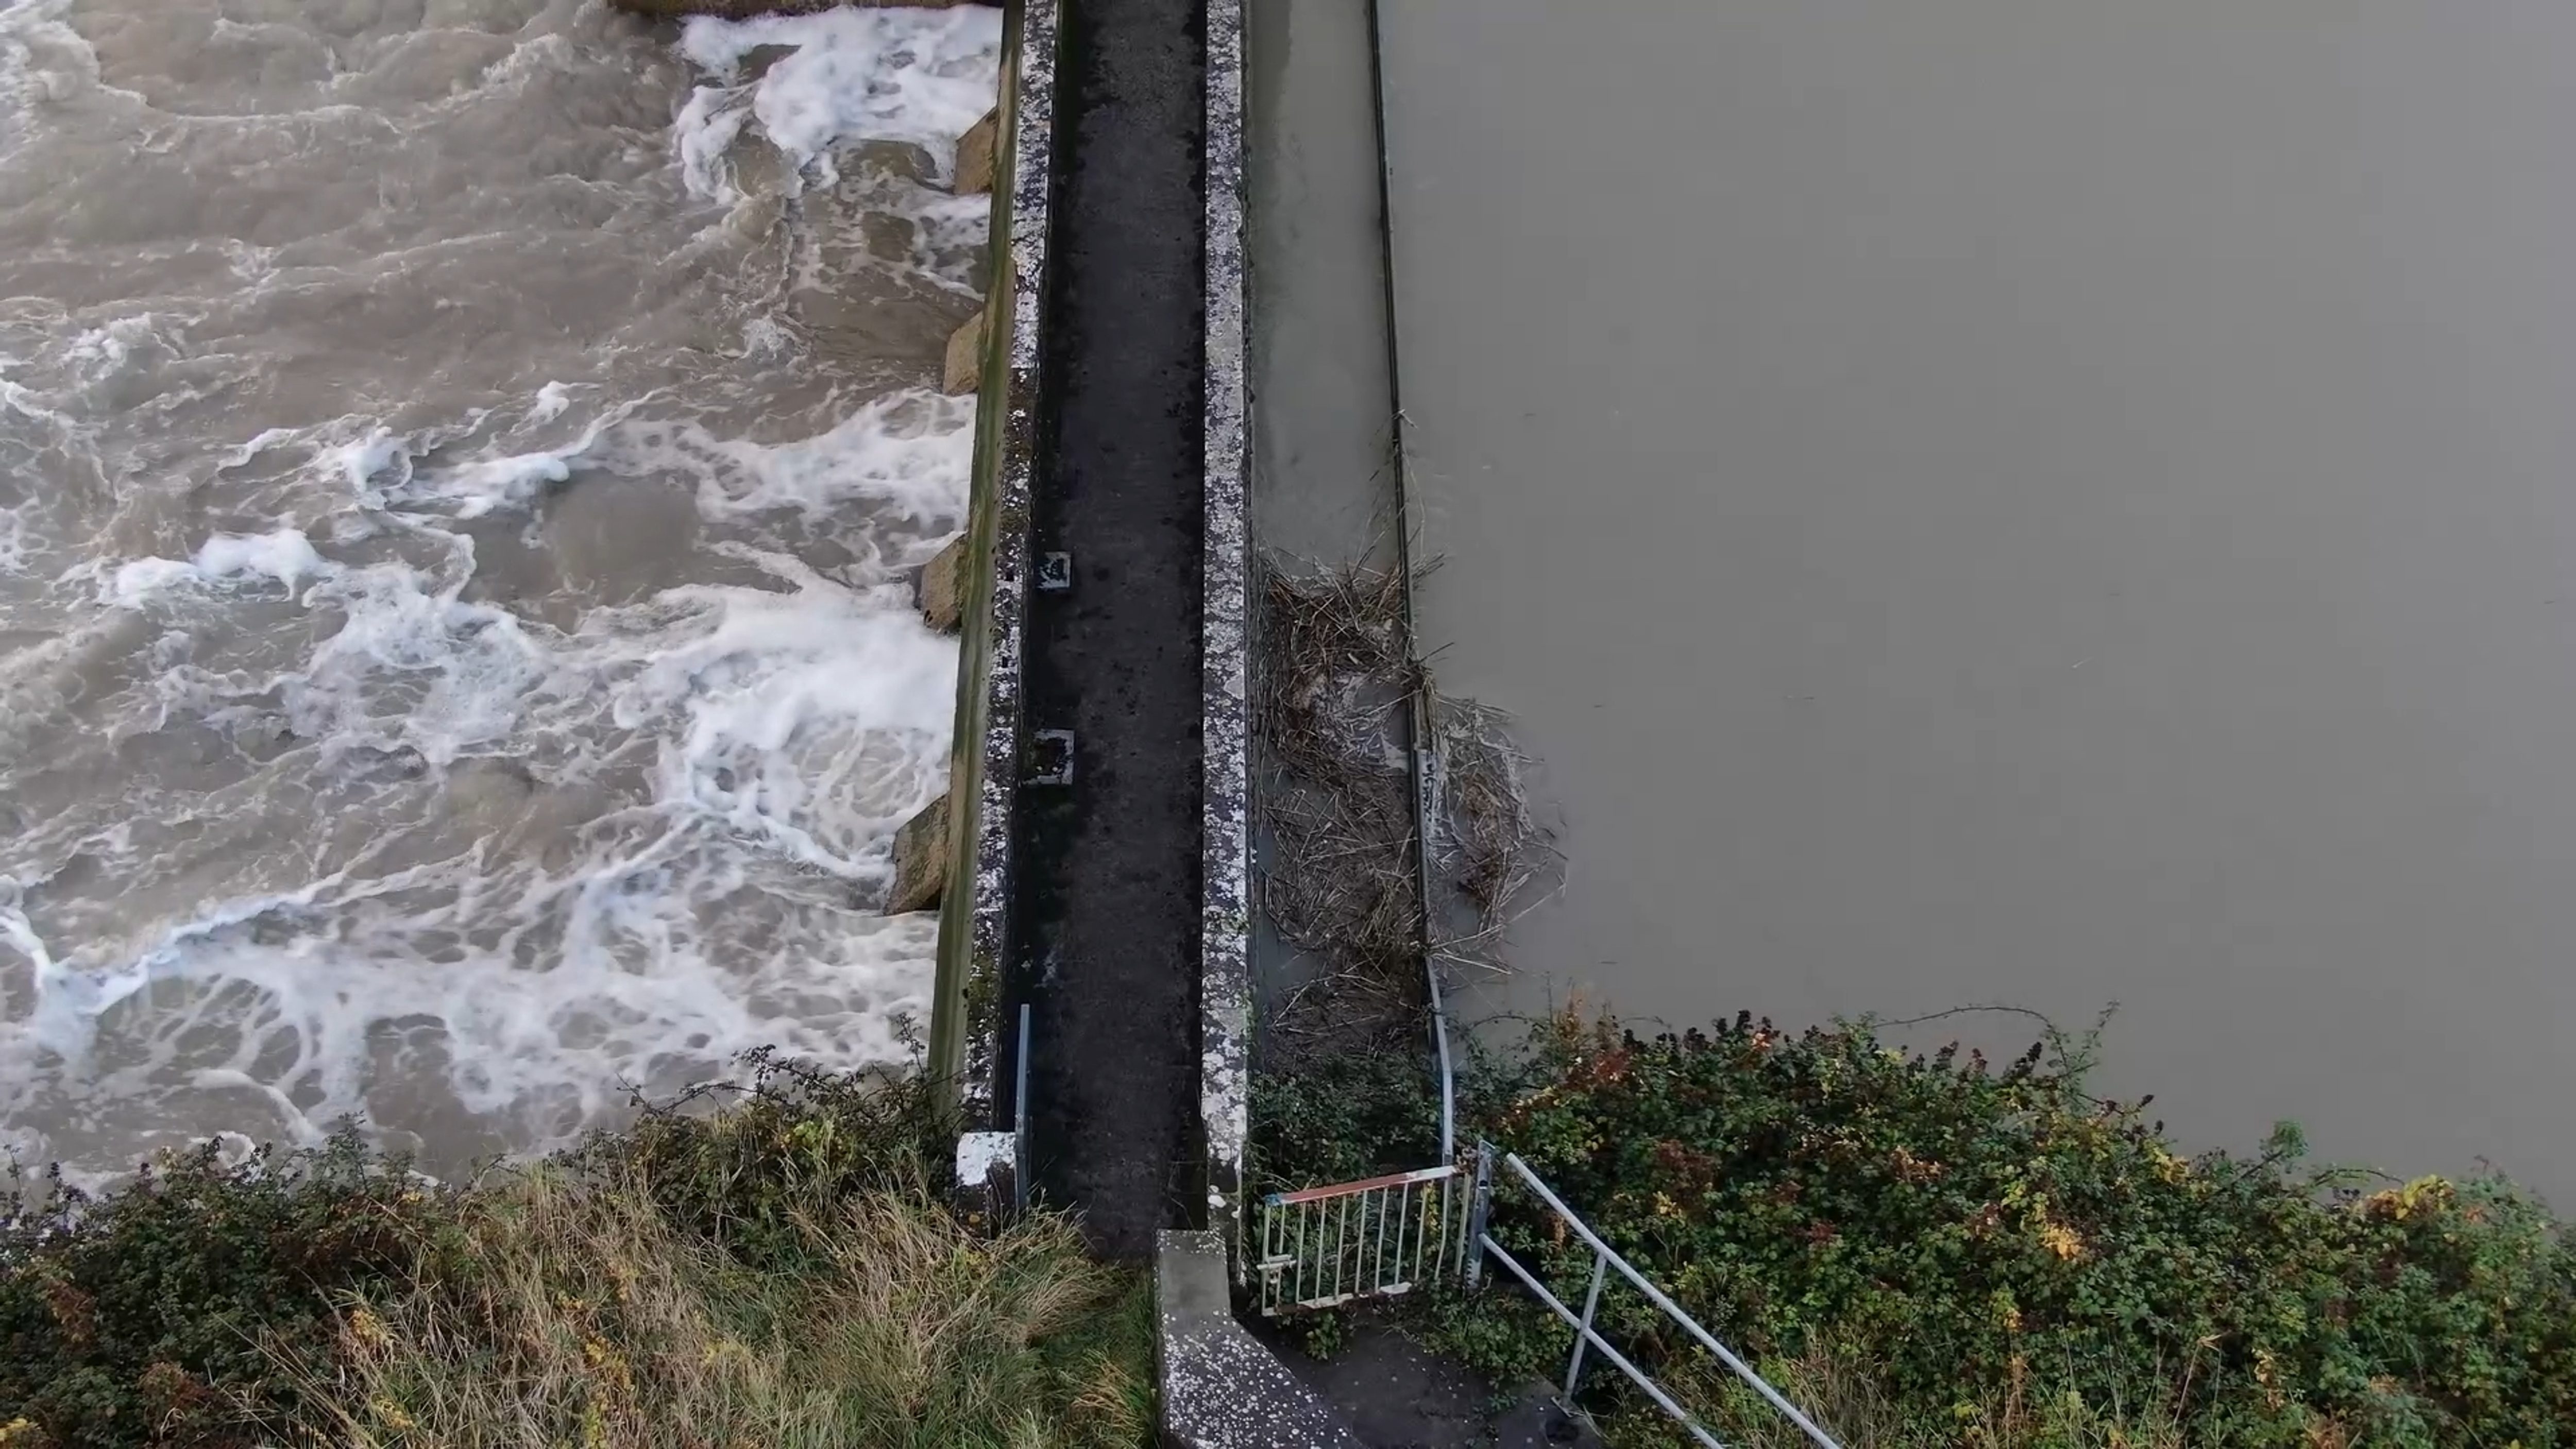
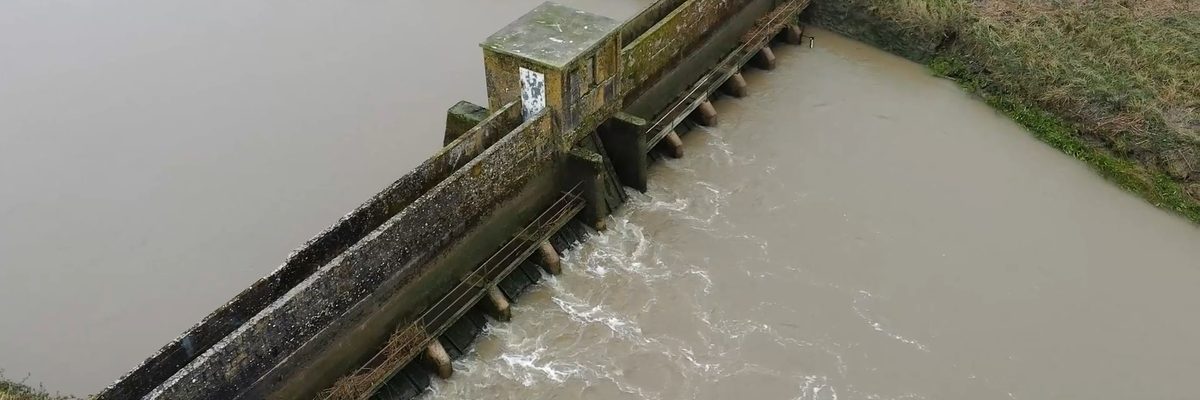
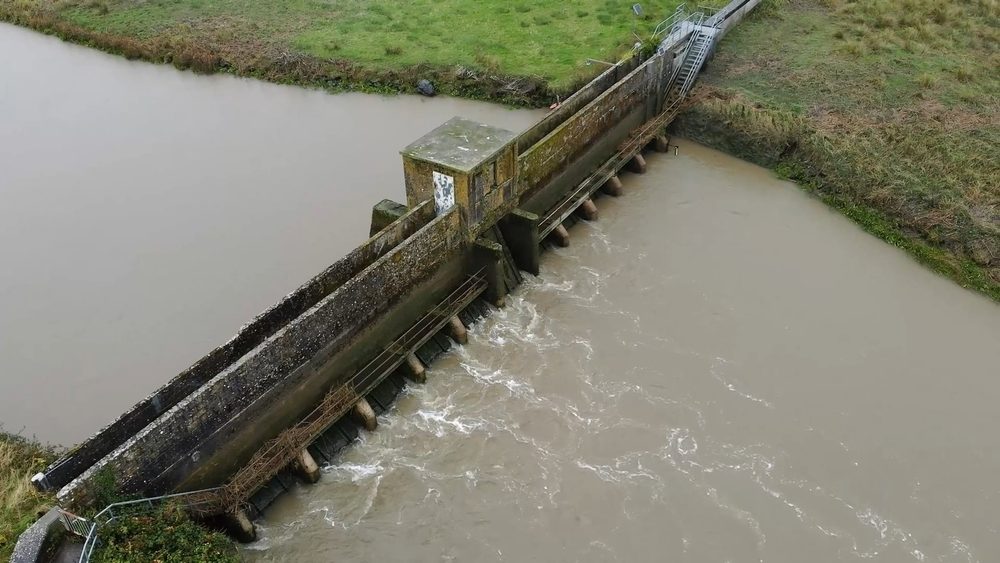
Wide aerial view of the complete barrage structure and surrounding riverbanks
Wide aerial view of the complete barrage structure and surrounding riverbanks on the Shannon tributary in County Clare.
Challenge

Tidal timing and safe access drove the approach

The tidal nature of the site created two distinct challenges. First, the data had to be captured at precise, repeatable intervals across the full 12-hour tidal cycle so the client could make like-for-like comparisons at each stage. Second, the barrage itself is not a large structure - meaning conventional access such as climbing onto the concretework or deploying a boat for the entire day would have been slow, awkward, and potentially unsafe. The client needed a way to gather the same visual data without putting personnel on or over the water.

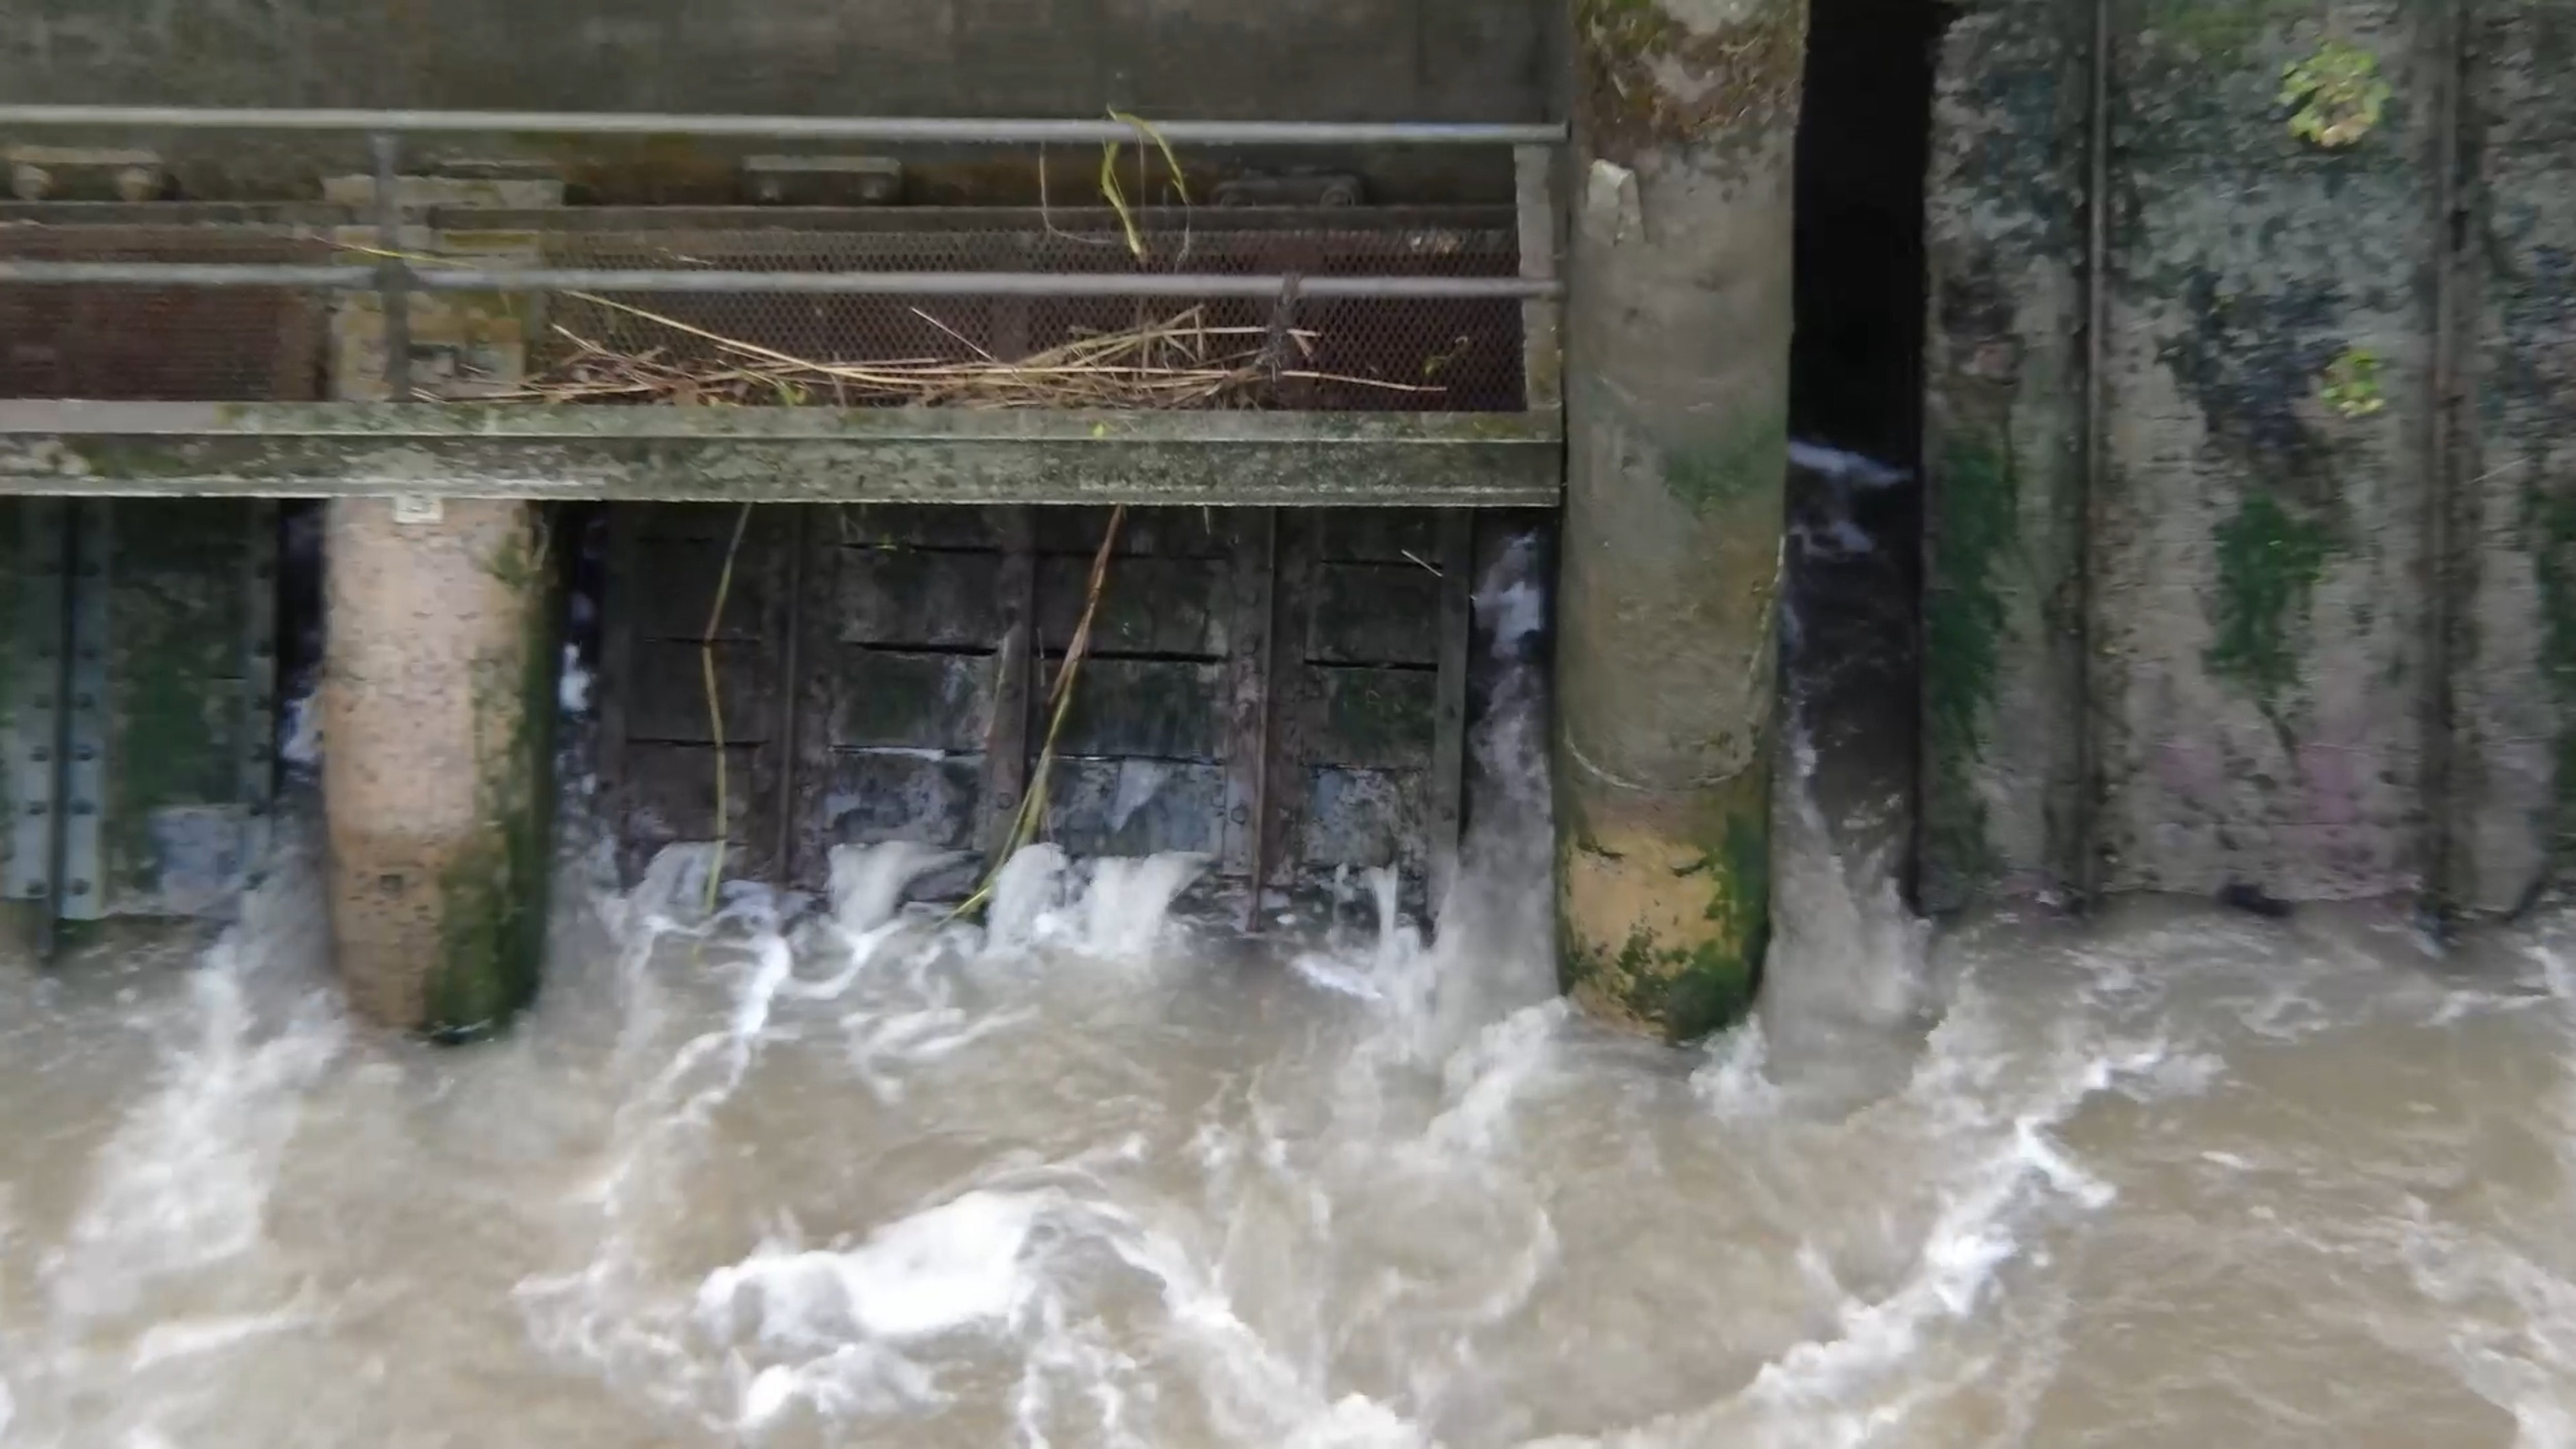
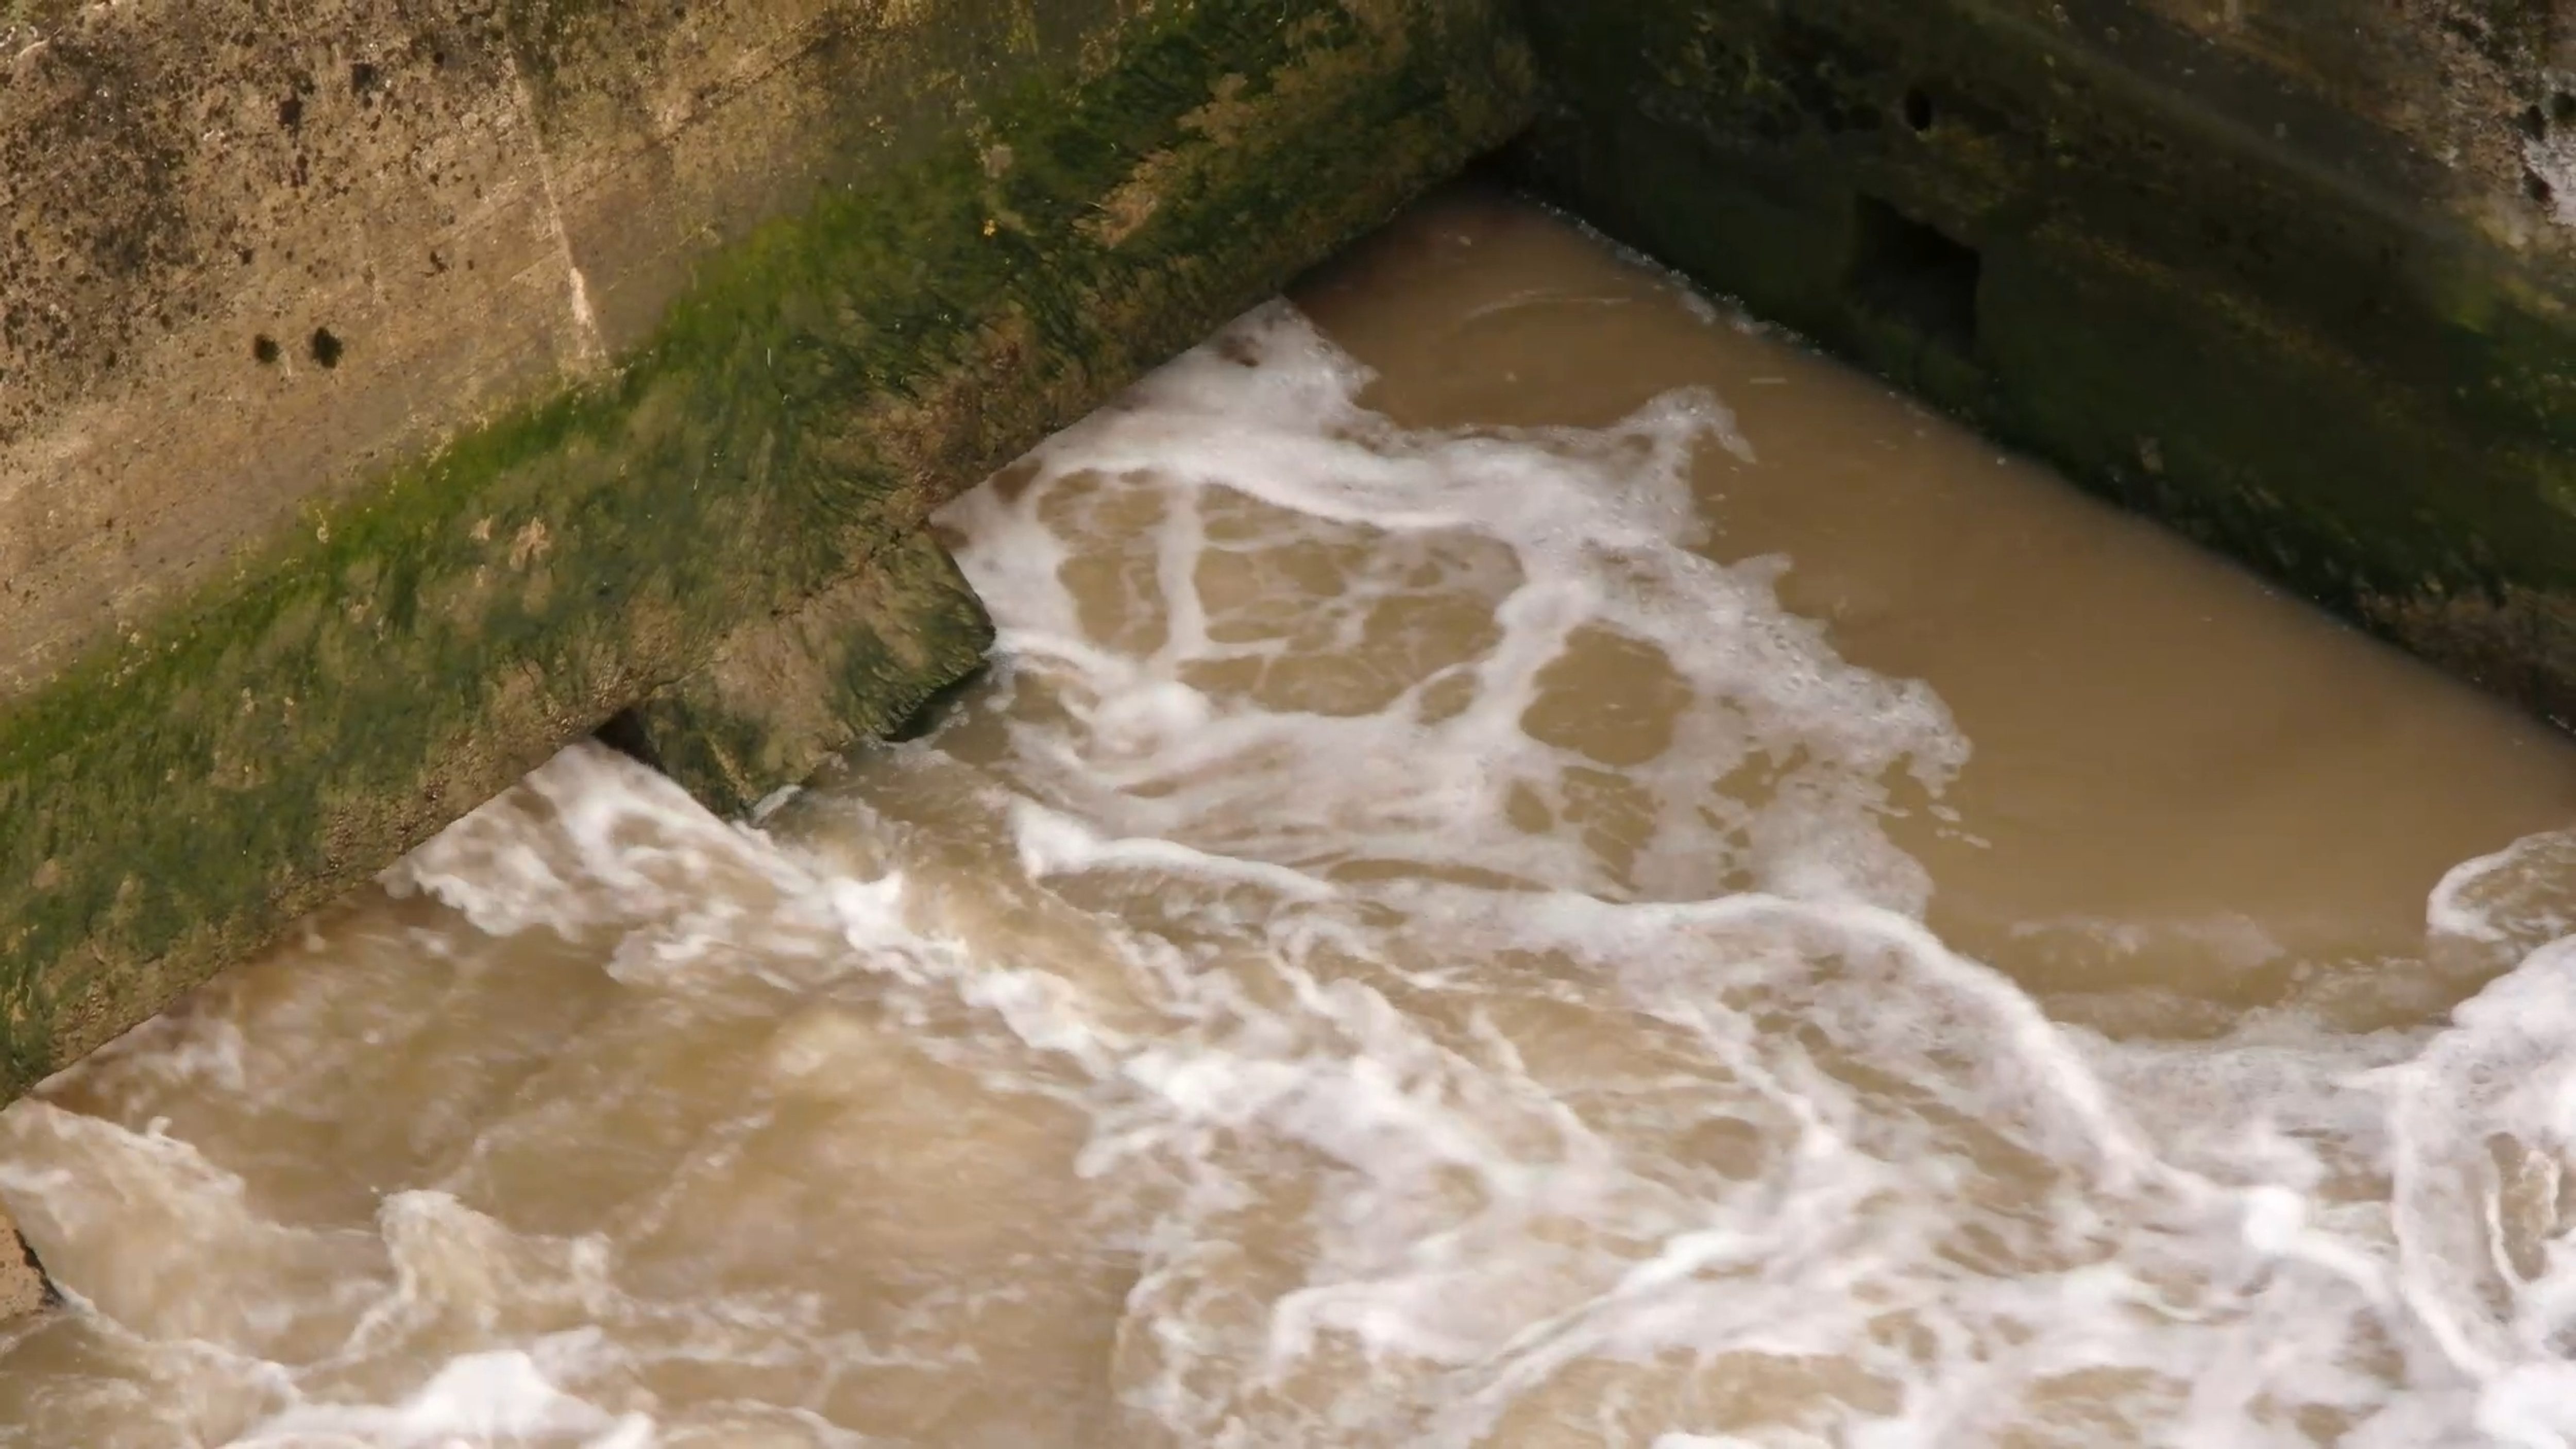
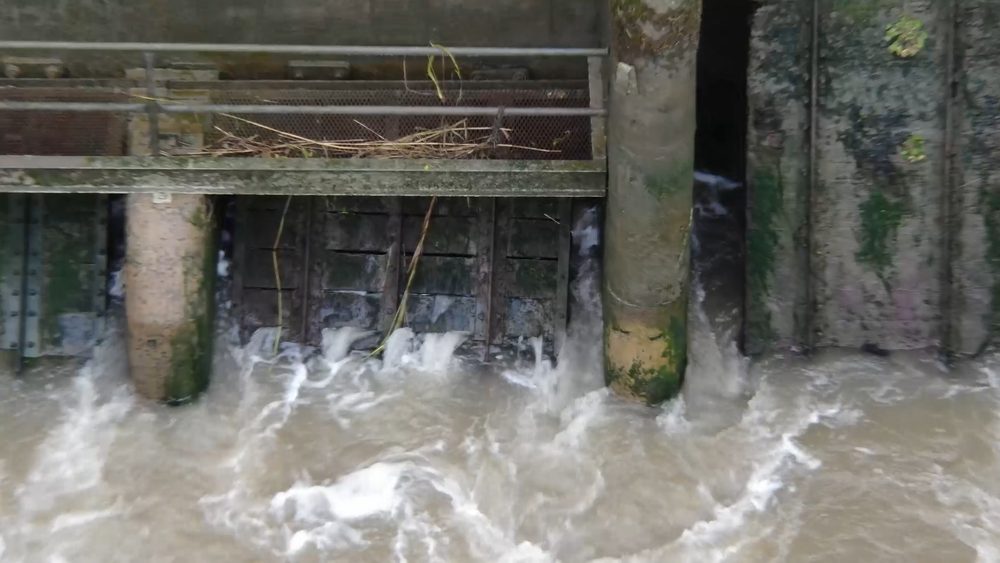
Close-up view of water discharging through the open barrage gates
Close-up view of water discharging through the open barrage gates during the tidal cycle.
Methodology

On the hour, every hour - a full day of systematic capture

After a detailed consultation with the client about exactly what they needed and when the tide would cooperate, we selected a day with a tide that fell halfway through daylight hours - giving us roughly six hours of light in the morning and six hours in the evening. The drone was deployed on the hour, every hour, throughout the full tidal cycle. At each interval we captured several minutes of 4K video, giving the client high-resolution footage of flow conditions, alongside still imagery for a more lightweight reference. All imagery was geotagged, so the client's engineers could correlate flow observations with exact positions on the barrage. Because every capture was taken from the same location at consistent intervals, the dataset allowed true like-for-like comparison: the client could see exactly how water levels and flow behaviour changed at a given gate from one hour before high tide through to one hour after, and across every stage in between.

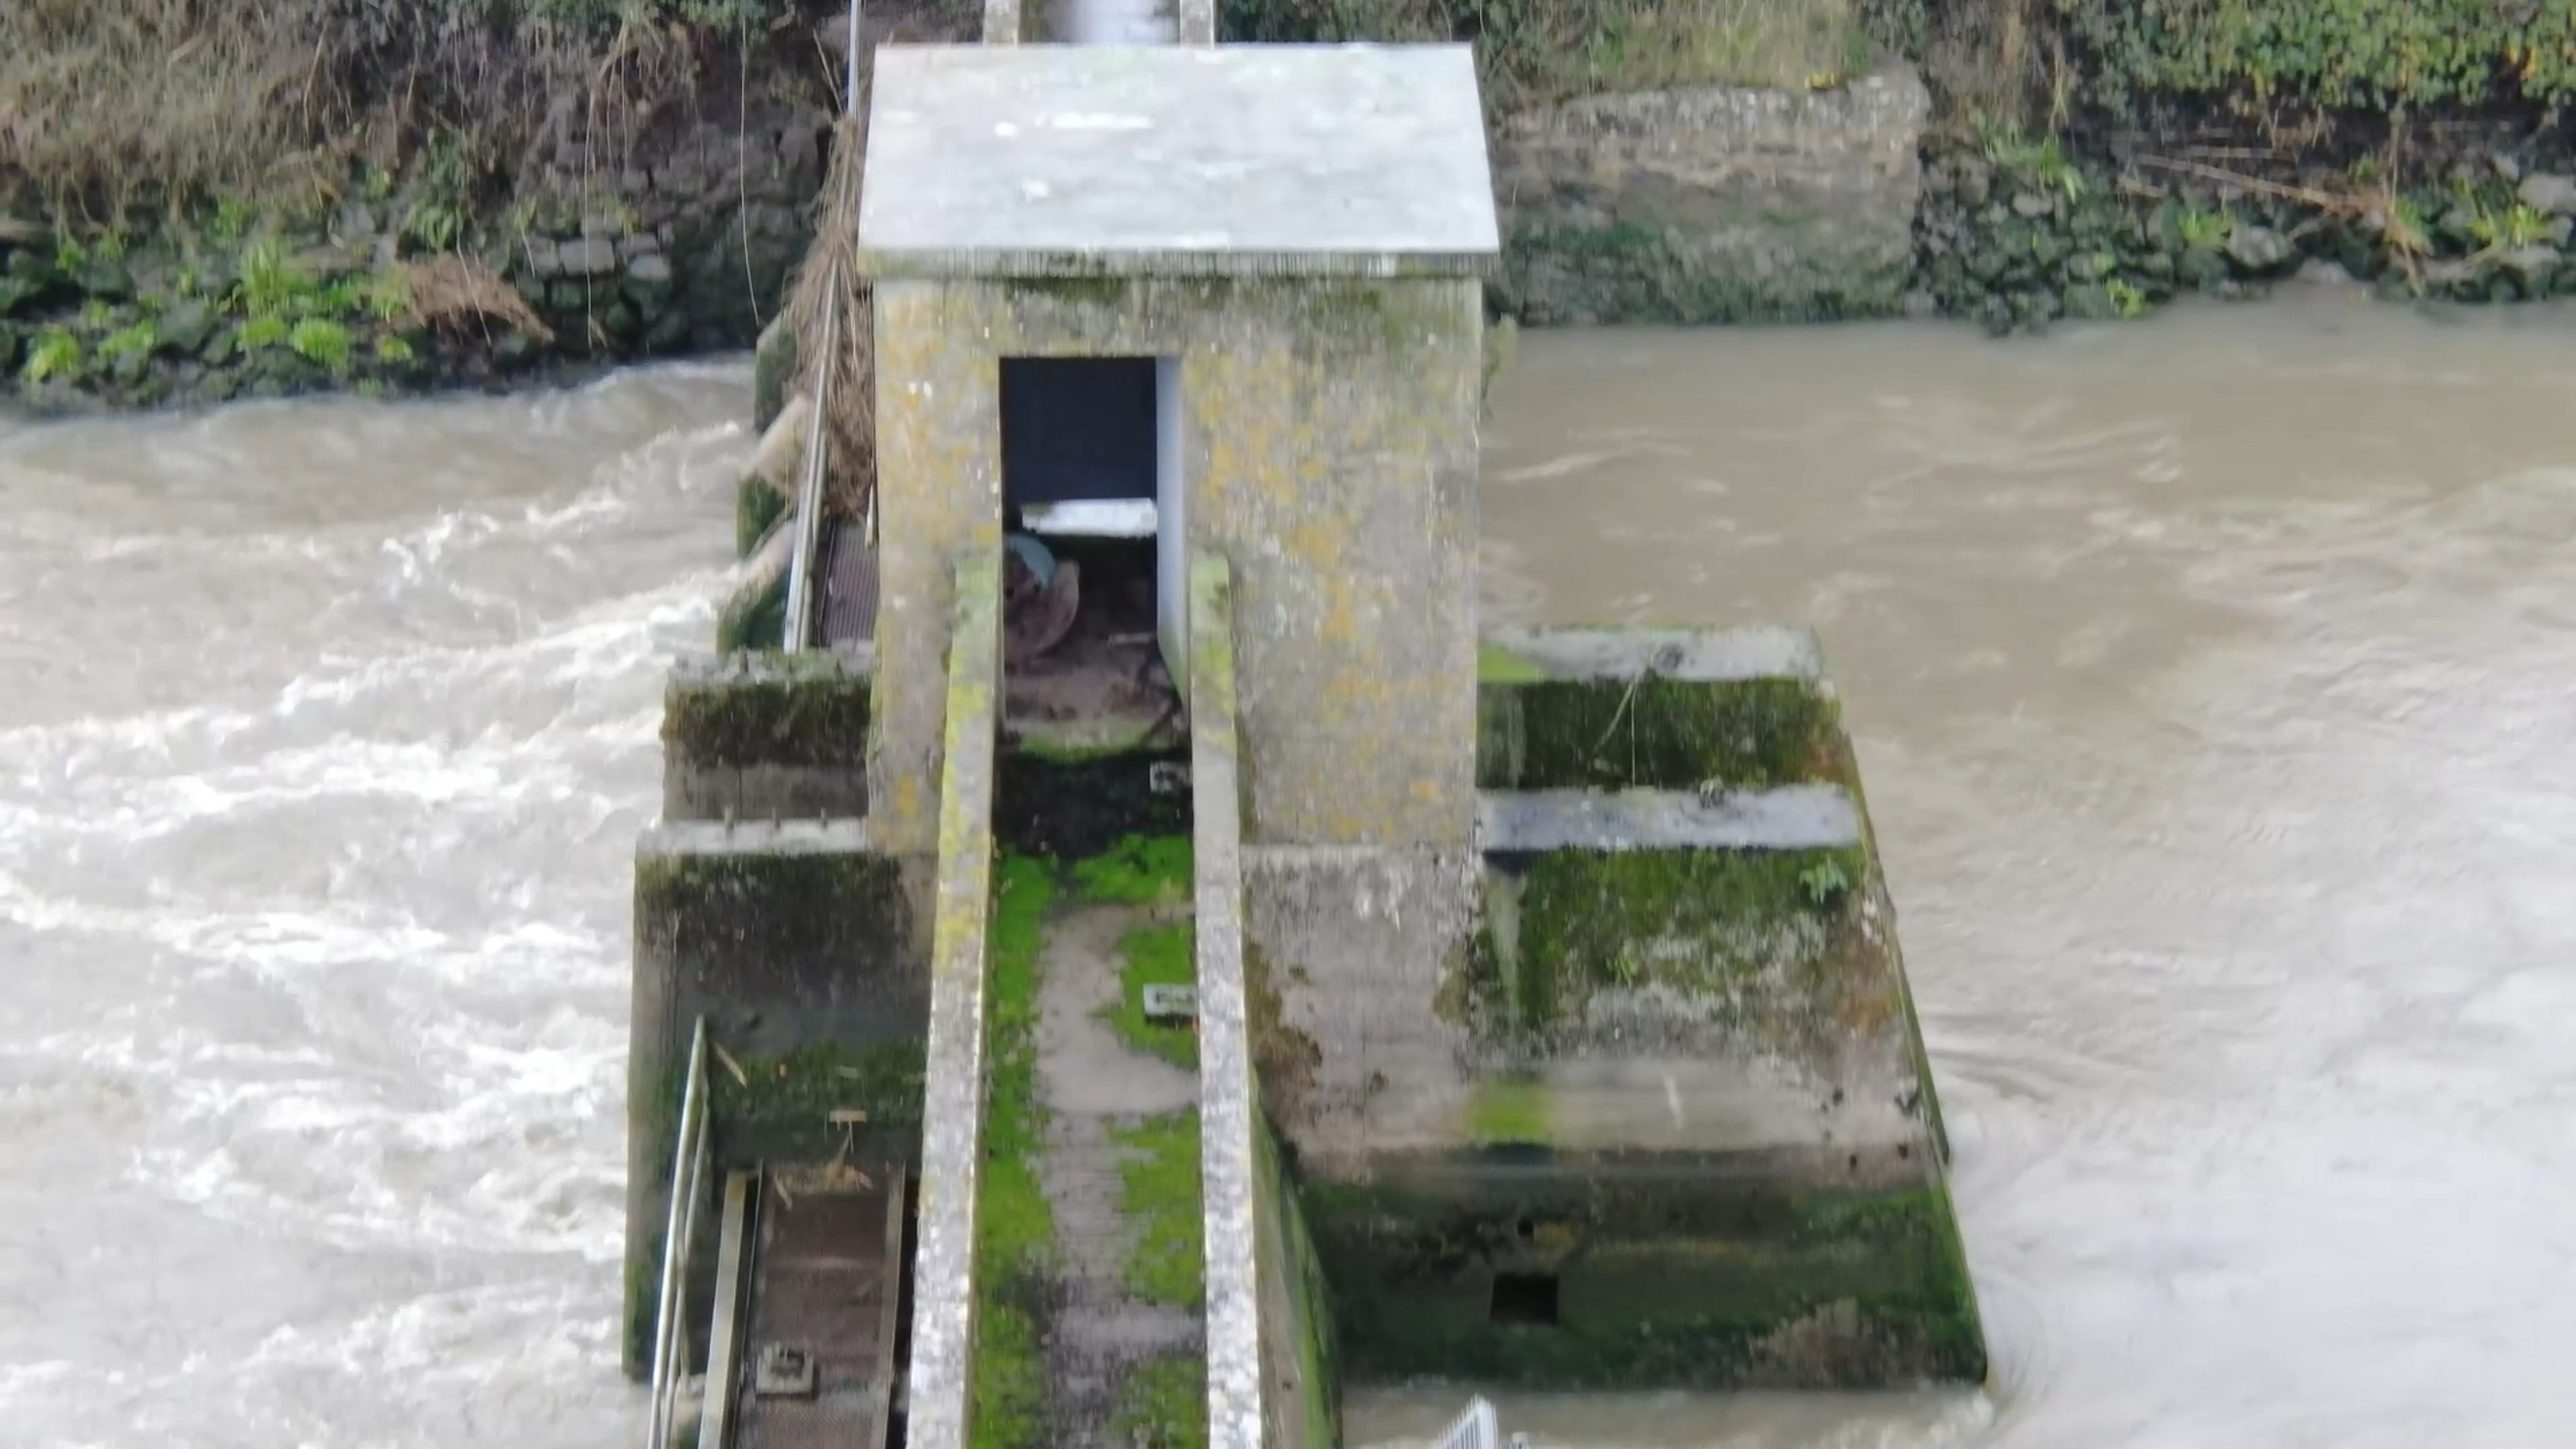
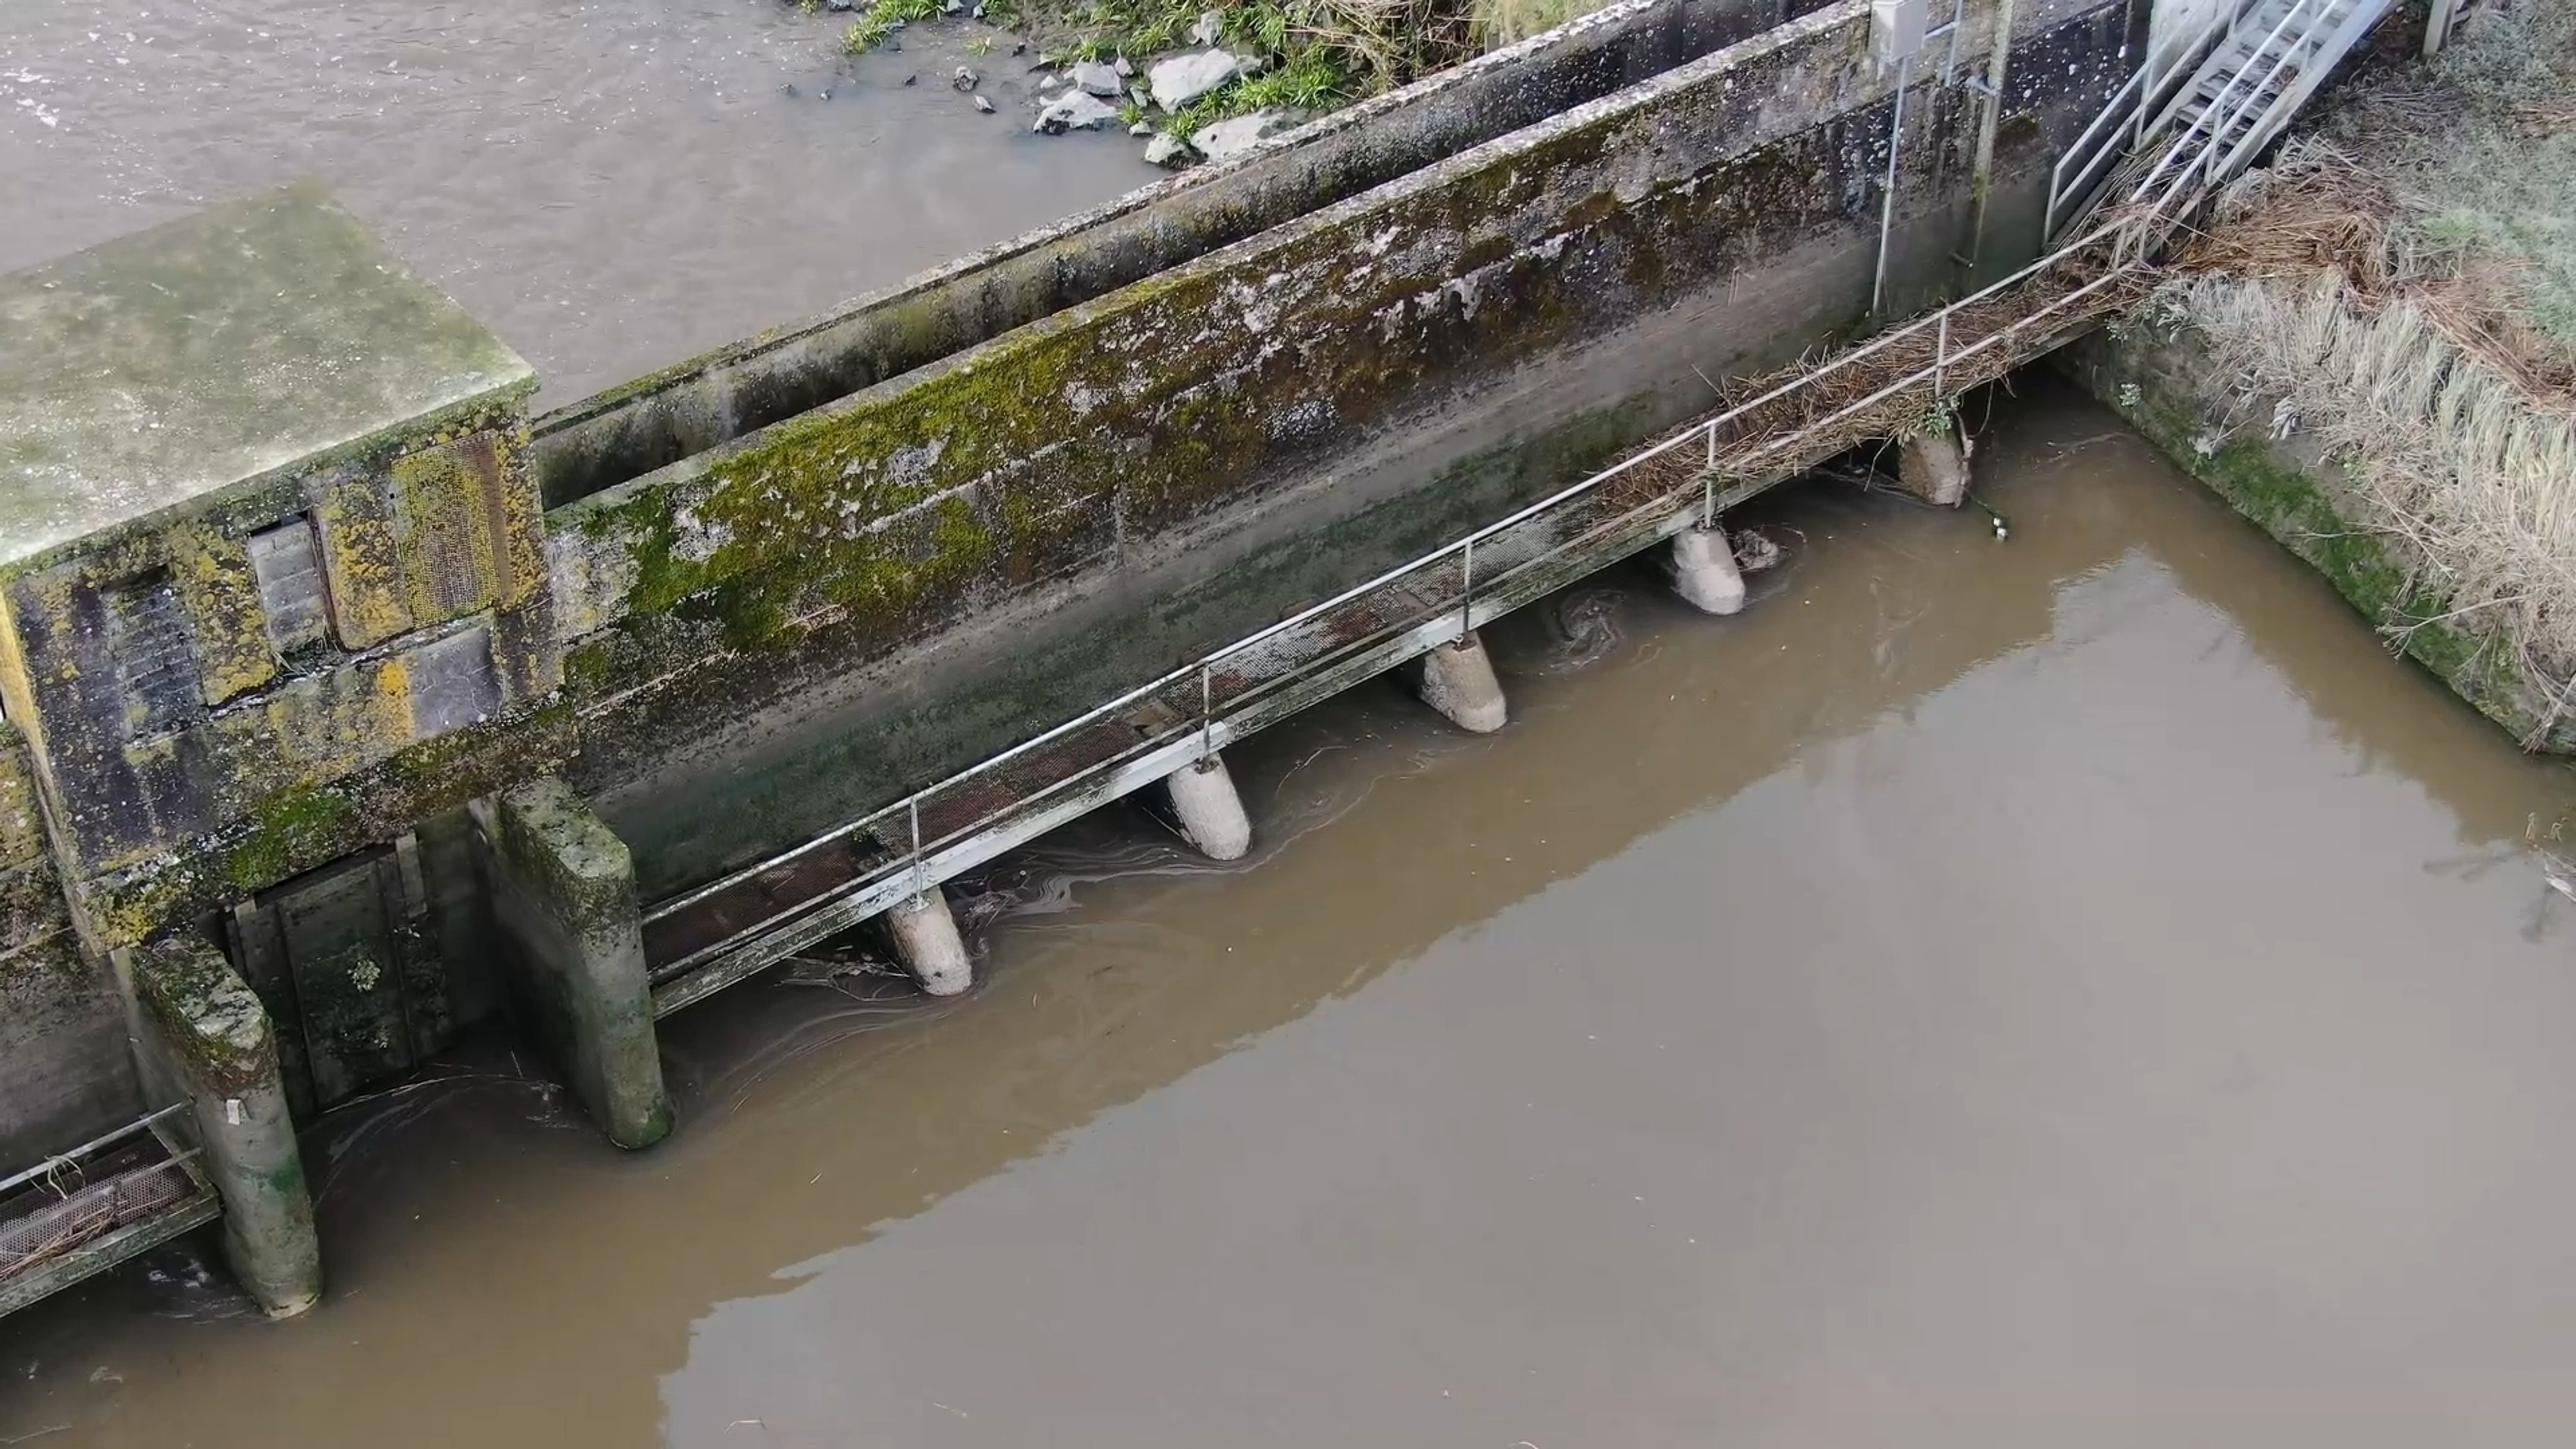
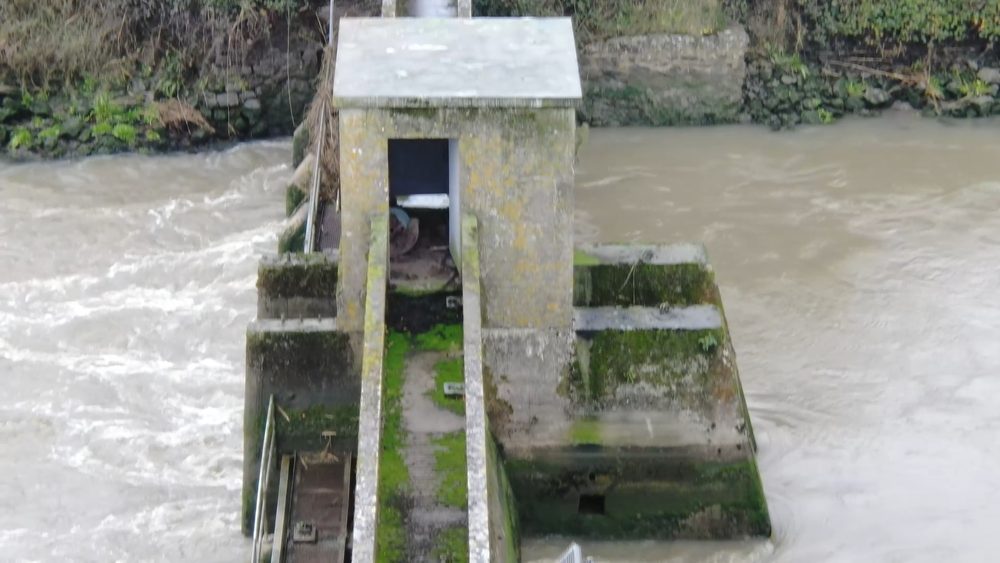
High-angle oblique view of the central control cabin and concrete walkway
High-angle oblique view of the central control cabin and concrete walkway on the barrage structure.
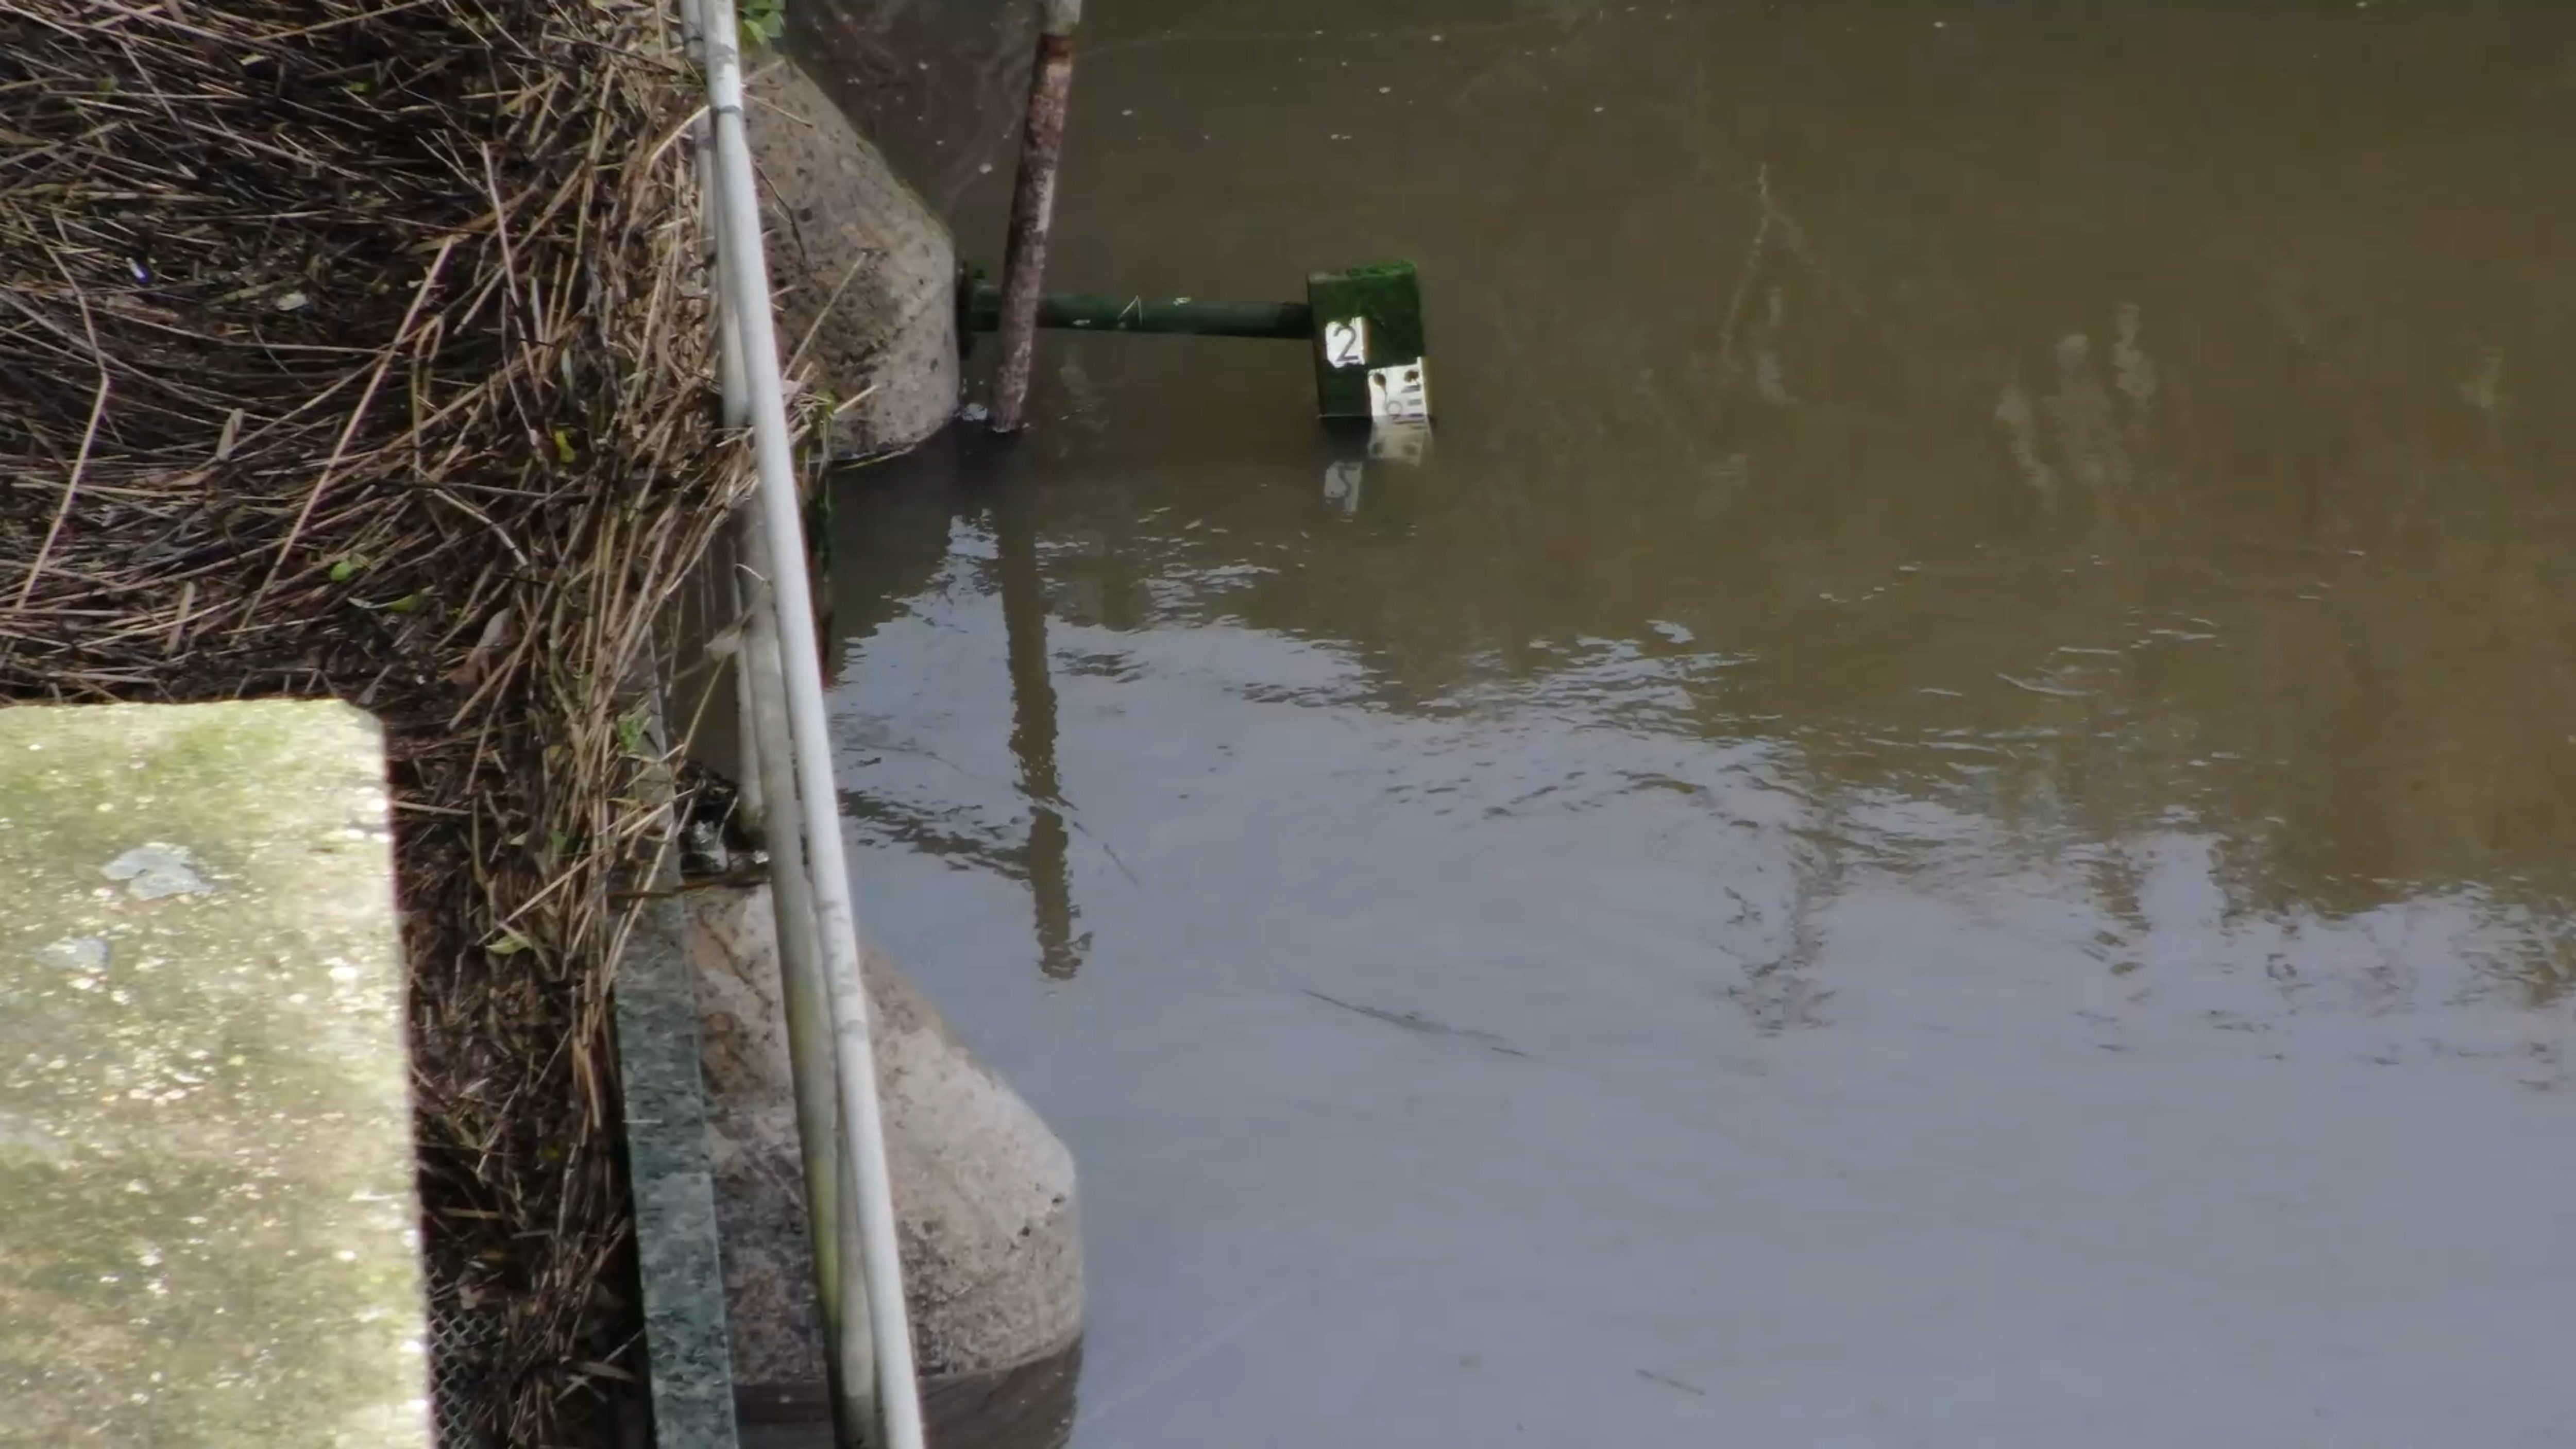
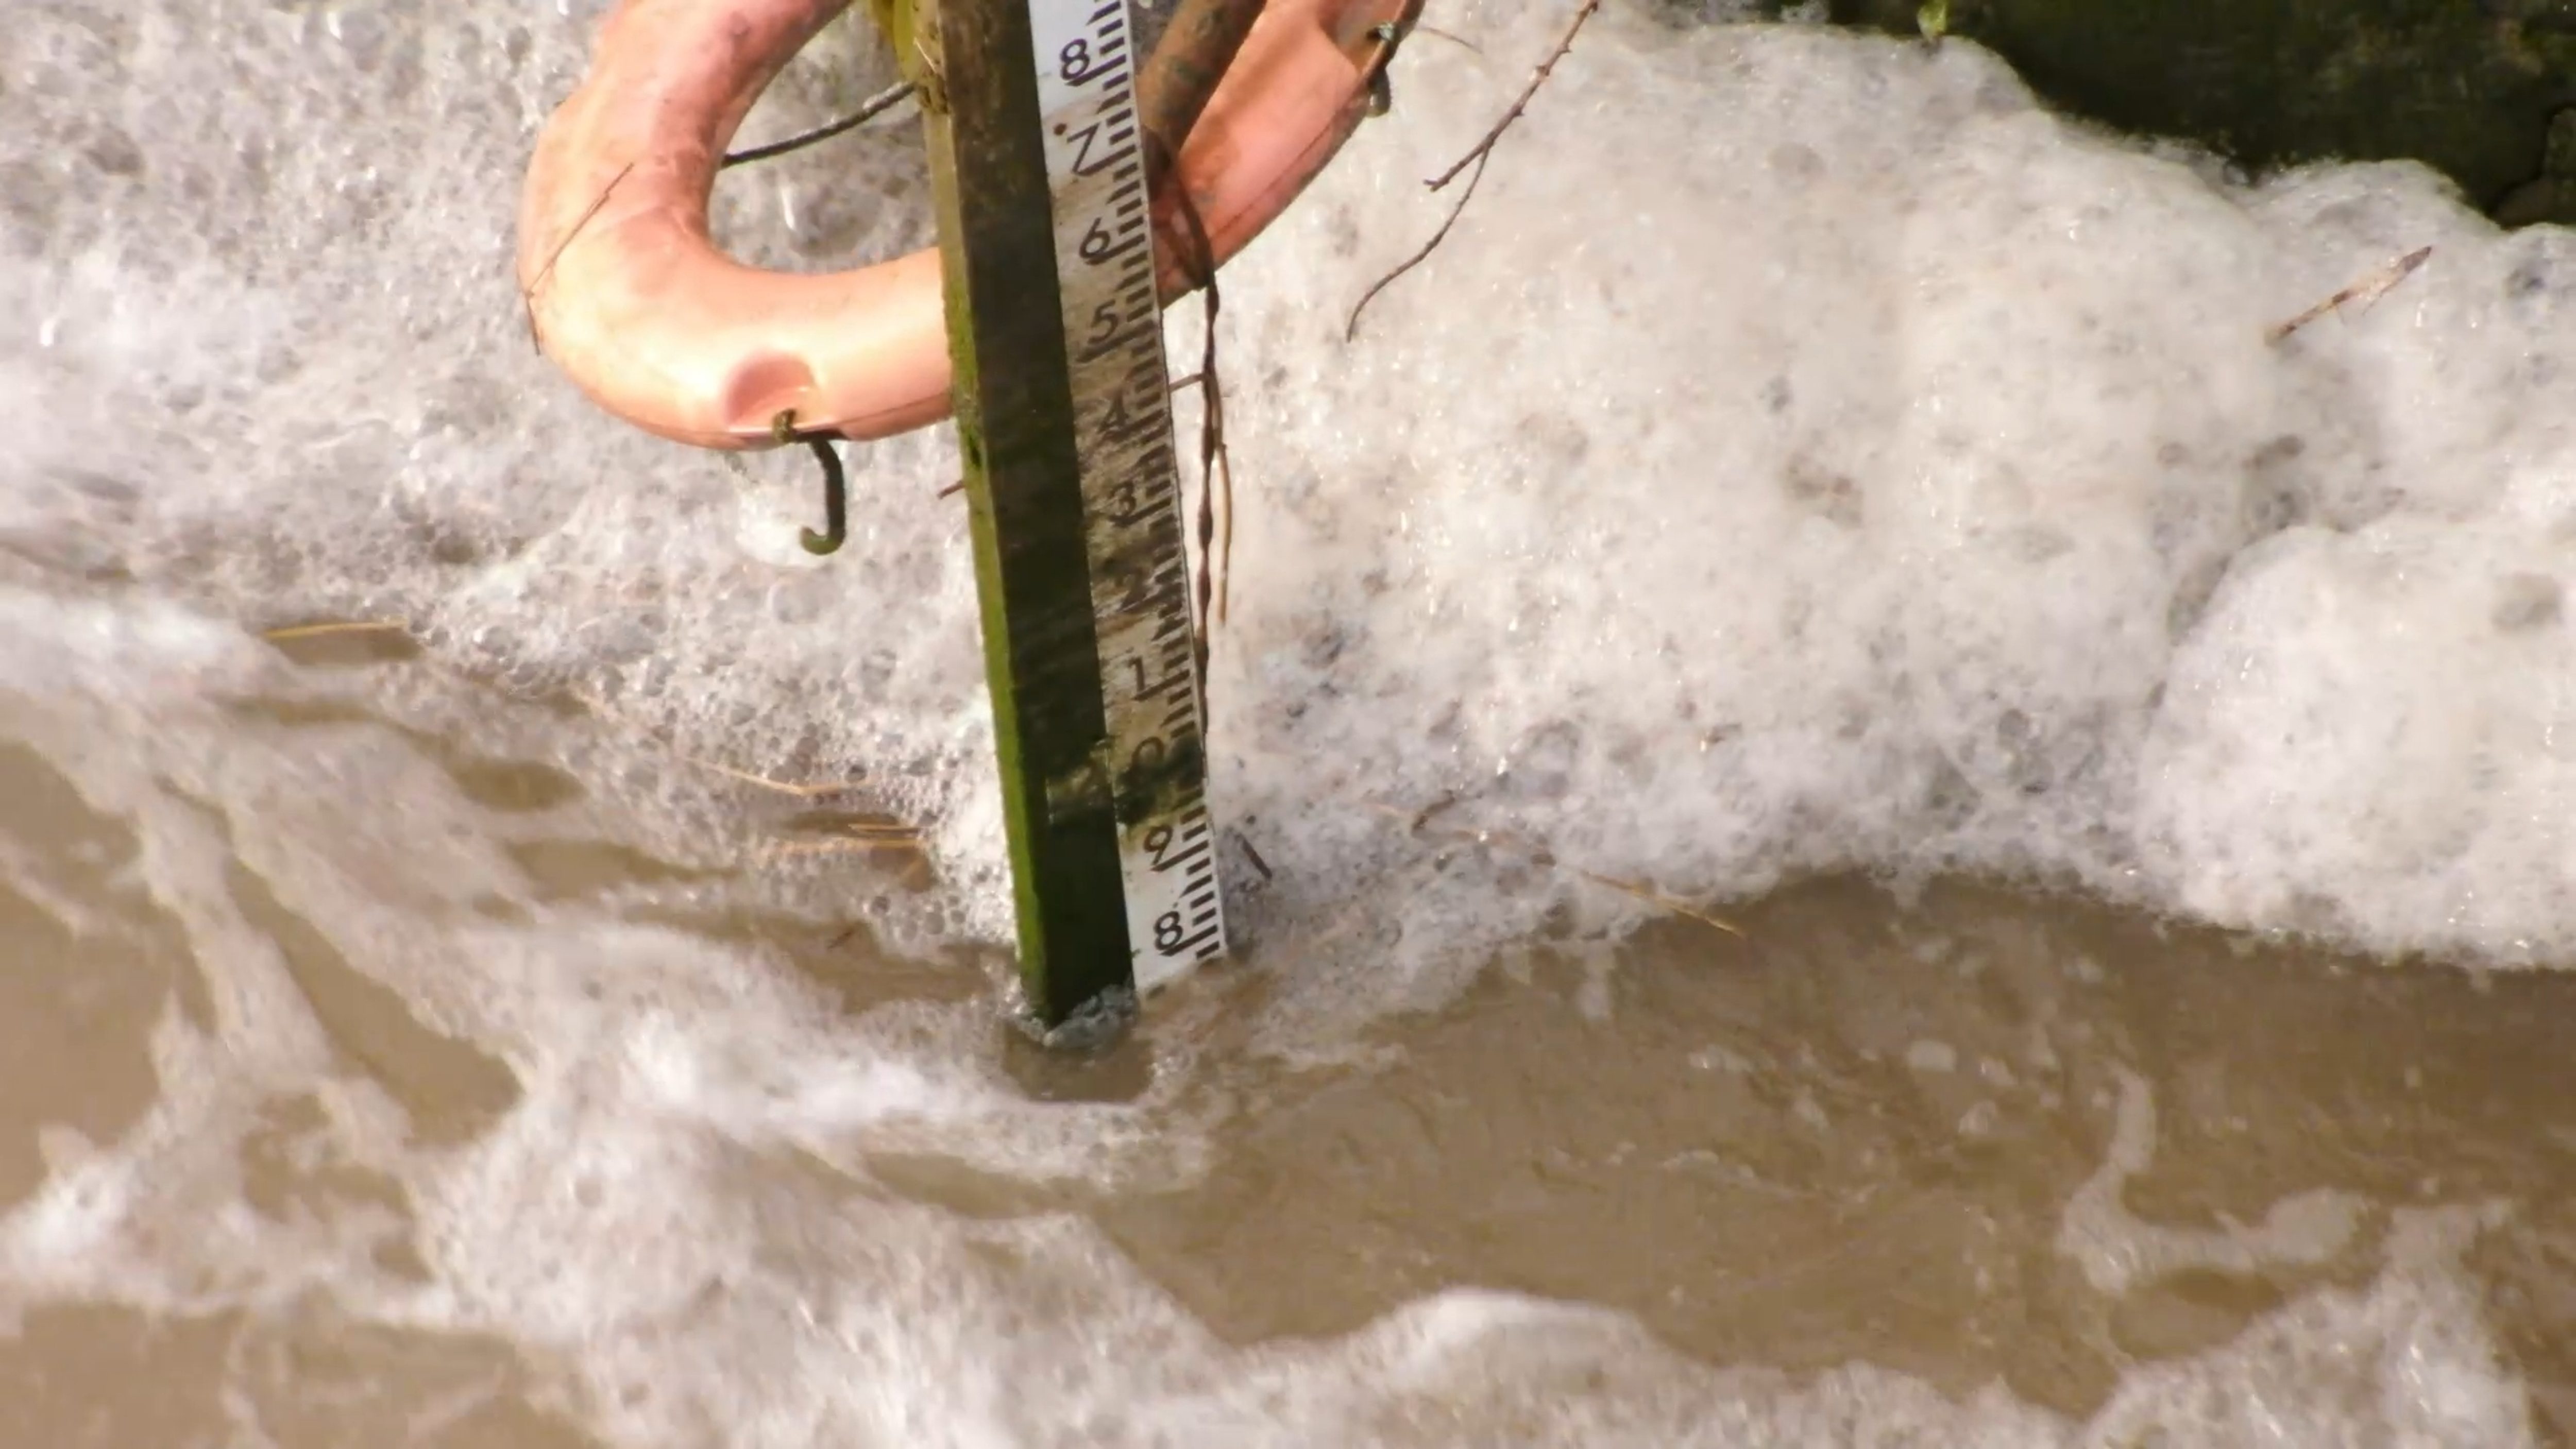
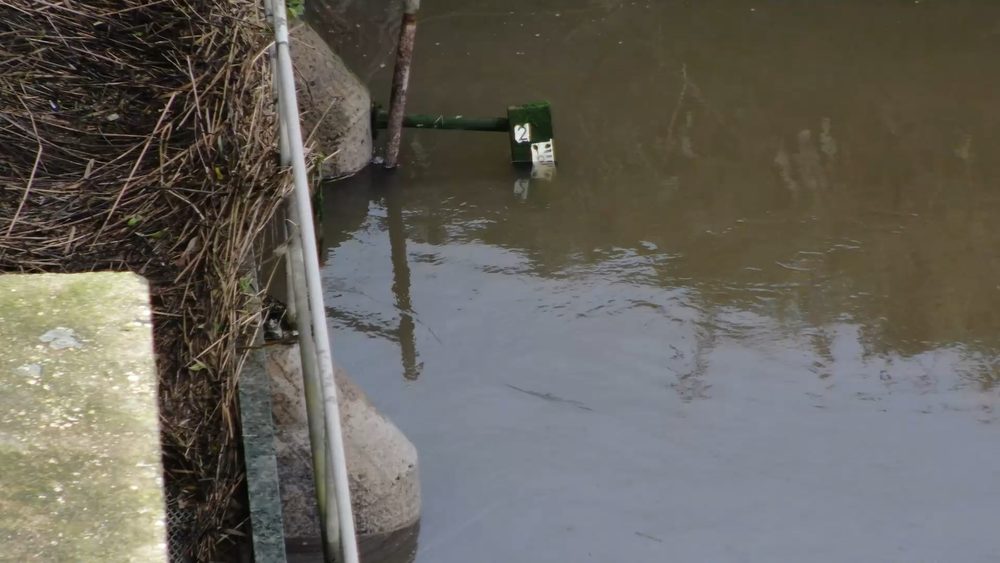
Close-up view of the staff gauge showing the water level reading at 17:00
Close-up view of the staff gauge showing the water level reading at 17:00 - one of the hourly data points captured throughout the tidal cycle.
Deliverables

A complete, organised dataset ready for engineering analysis

4K video by the hour

Several minutes of high-resolution 4K video captured at every hourly interval across the full tidal cycle, giving the client a clear visual record of flow conditions from start to finish.

Geotagged still imagery

High-resolution still images captured alongside video at each interval, all carrying precise location data for correlation with specific positions on the barrage structure.

Collated dataset

All footage and imagery organised into a structured dataset that stood on its own - the client's engineers could open it, understand it, and begin analysis without needing a walkthrough call.

Like-for-like comparison

Because every capture was taken from the same position at consistent intervals, the client could compare flow conditions hour by hour across the entire tidal cycle with complete confidence.

Comparative methodology

Why they chose us

The client needed precise visual data of water flow at specific stages of the tide across a full tidal cycle. Traditional methods would have meant deploying boats for the entire day or sending personnel onto the barrage structure itself - both slow and potentially unsafe. A drone delivered the same data with zero access risk.

Data cadence
On the hour, every hour vs intermittent boat-based sampling

A full tidal cycle captured at consistent intervals, giving the client true like-for-like comparison at every stage of the tide.

Safety
Zero access risk vs climbing on structure or boats

No personnel needed to climb the barrage, work over water, or sit in a boat for 12 hours. The drone operated safely from the bank.

Geospatial context
Geotagged by default vs loose location notes

Every image and video clip carried precise location data, so the client's engineers could correlate flow conditions with exact positions on the structure.

Efficient option Our method

Using a drone

A safe, efficient approach that captured a complete tidal dataset in a single day.

  • Full tidal cycle, on the hour 4K video and still imagery captured at every hour of the tide - one hour before high tide, one hour after, two hours, three hours, and so on - giving the client a complete record of flow conditions from start to finish.
  • Geotagged imagery throughout Every image and video frame carried precise location data, allowing the client's engineers to correlate flow observations with exact positions on the barrage structure.
  • Zero personnel at risk The drone operated from the riverbank throughout. No one needed to climb the barrage, work over water, or spend the day on a boat.
  • One day of fieldwork A tide halfway through the day was selected, giving six hours of daylight on either side. The entire dataset was captured in a single, well-planned field day.
  • Self-explanatory deliverables All data was collated and organised so the client could understand and use it immediately - no engineer handover call needed to explain what was what.
Project status Completed and delivered
Manned approach Traditional method

Without a drone

The slower, less safe conventional approach.

  • Boats or climbing required The client would have needed to deploy boats and sit on the water for the full tidal cycle, or send personnel onto the barrage structure - which is not designed for safe access.
  • Harder to maintain hourly cadence Coordinating consistent hourly data capture from a boat or from positions on the structure is significantly more difficult than a pre-programmed drone flight pattern.
  • No integrated geotagging Manually captured imagery requires separate location notes and cross-referencing, increasing the risk of error and the time needed to produce a usable dataset.
  • Personnel on or over water Working on a tidal barrage or from a boat for a full 12-hour cycle introduces safety risks that the drone method eliminated entirely.
Operational impact Slower, less safe, and less precise
Let's talk

Speak to an engineer about your project

Complex surveys and inspections require more than just a pilot. Our engineers can help you scope your requirements and indentify the right approach.

Talk to an engineer

+353 (0)21 202 8281

Quickest for technical scoping

Email your brief

info@engineerswithdrones.ie

Best for sending detailed specs

Wide aerial view of the complete barrage structure and surrounding riverbanks
Close-up view of water discharging through the open barrage gates
High-angle oblique view of the central control cabin and concrete walkway
Aerial view of the barrage gates and surrounding water levels
Close-up view of the staff gauge showing the water level reading at 17:00
Oblique aerial view of the barrage structure and riverbanks
Downstream view of the tidal flood defence barrage
Upstream aerial view of the barrage and approaching water
Aerial perspective of the barrage in its surrounding landscape
Next steps

Where to find out more

If you manage tidal infrastructure, flood defences, or water management assets and need visual data that lets you understand how your structures are performing, drone-based aerial data collection could be the solution. Explore related services and case studies below.

Last updated: