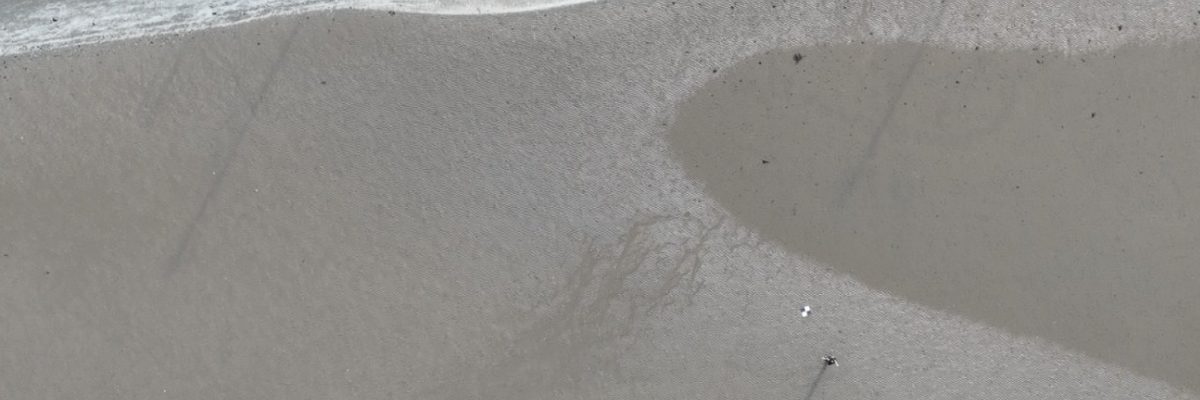
Aerial view of a wide intertidal beach on the south Dublin coast at low tide, captured by drone

Mapping Dublin beach landfalls

Two intertidal landfall sites on the south Dublin coast, captured by drone at the lowest astronomical tide.
Overview

The Job at a Glance

A drone photogrammetry survey of the intertidal zone at two beach landfall sites on the south Dublin coast, captured at the lowest astronomical tide to deliver a DTM, point cloud and orthophoto for an offshore cable landfall project.

Two landfall sites

A beach where a new cable run comes ashore, and a second beach across Dublin Bay where it returns to the seabed.

Lowest astronomical tide

Fieldwork was timed to the lowest astronomical tide of the period, so the widest possible slice of the intertidal zone was exposed and captured.

Extensive ground control

Ground control points were laid across both sites before capture, to georeference the photogrammetric dataset accurately.

Three core deliverables

A digital terrain model, a point cloud and an orthophoto for each site, plus overview imagery of the coastline.

Background

A power cable nearing the end of its life

One of the primary electrical conductors in the country runs along the shore in south County Dublin. The cable is quite old now and is reaching the end of its useful life, so a replacement needs to be laid. Running a new cable along the same route would be very difficult, so a different path was chosen: the new run comes out of a beach on the south Dublin coast, travels across Dublin Bay, and comes back in at a second beach on the far side.

That route is much easier to build. Instead of digging up streets along the shore, the seabed is disturbed only momentarily to install the cable.

The brief

Mapping the seabed and the beach

To plan the route accurately, the project team needed a good understanding of the topography they were dealing with, both under the water and on the beach. Out in the bay they used bathymetry, capturing the underwater topography from a boat. But in the intertidal zone, the strip of beach that only dries out at low tide, the best data comes from really accurate aerial imagery, and the right tool for that is a drone flying a photogrammetry mission.

We were asked to capture that intertidal zone at both landfall points, where the cable comes ashore and where it returns to the seabed, so the beach data could be combined with the offshore bathymetry into one continuous picture of the route.

Methodology

Capturing the intertidal zone at low tide

Timing was everything on this job. The intertidal zone is only fully exposed for a short window around low tide, so we waited for the lowest astronomical tide of the period and deployed to site. Before any capture, we laid out an extensive set of ground control points across the working area, so the whole photogrammetric dataset could be tied back to a known, accurate position.

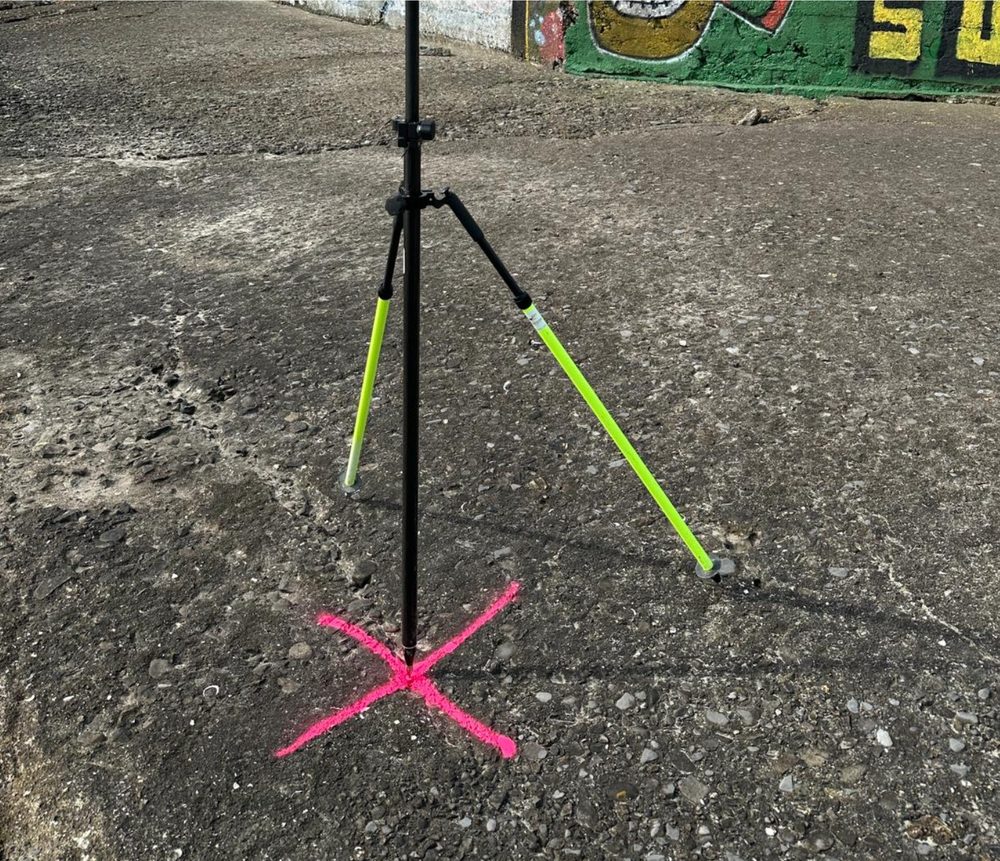
A ground control point mounted on a tripod over a spray-painted survey cross marking its position on the coastal ground
One of the ground control points set out on site. Extensive ground control was laid across both landfalls before capture.

With the tide all the way out, we captured a full photogrammetric dataset across a large stretch of the Dublin coastline in the intertidal zone, at both the location where the cable comes out and the location where it goes back in. That gave us complete, high-accuracy coverage of the exposed beach at each landfall point, rather than isolated measurements here and there.

Deliverables

What the client received

We processed the captured imagery into a set of core datasets for each landfall site, ready to be used on their own or combined with the bathymetry data from the bay.

Digital terrain model (DTM)

A bare-earth terrain model of the intertidal zone at each landfall site, delivered in a consistent, georeferenced coordinate system.

Point cloud

Dense 3D point data of the exposed beach surface, georeferenced from the ground control network laid out on site.

Orthophoto

A geometrically accurate, top-down image of each site, corrected so true distances and areas can be measured directly from it.

Overview imagery

Additional overview imagery of the coastline around each landfall point, supplied alongside the three core datasets.

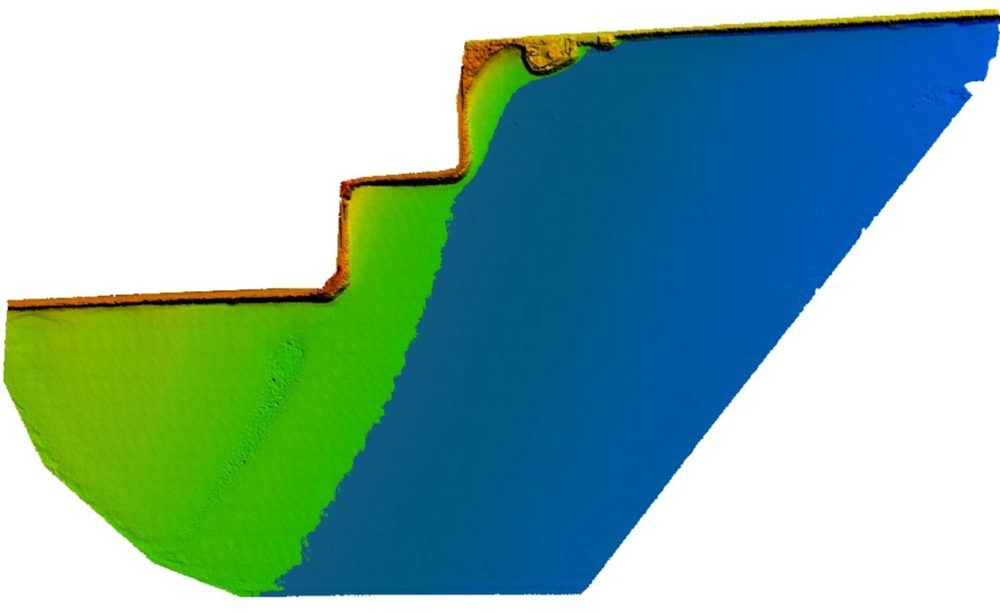
Colourised terrain model of the intertidal zone sloping from the beach down to the water at a landfall site
The digital terrain model of the intertidal zone at a landfall site, colourised to show the slope from the beach down to the water.
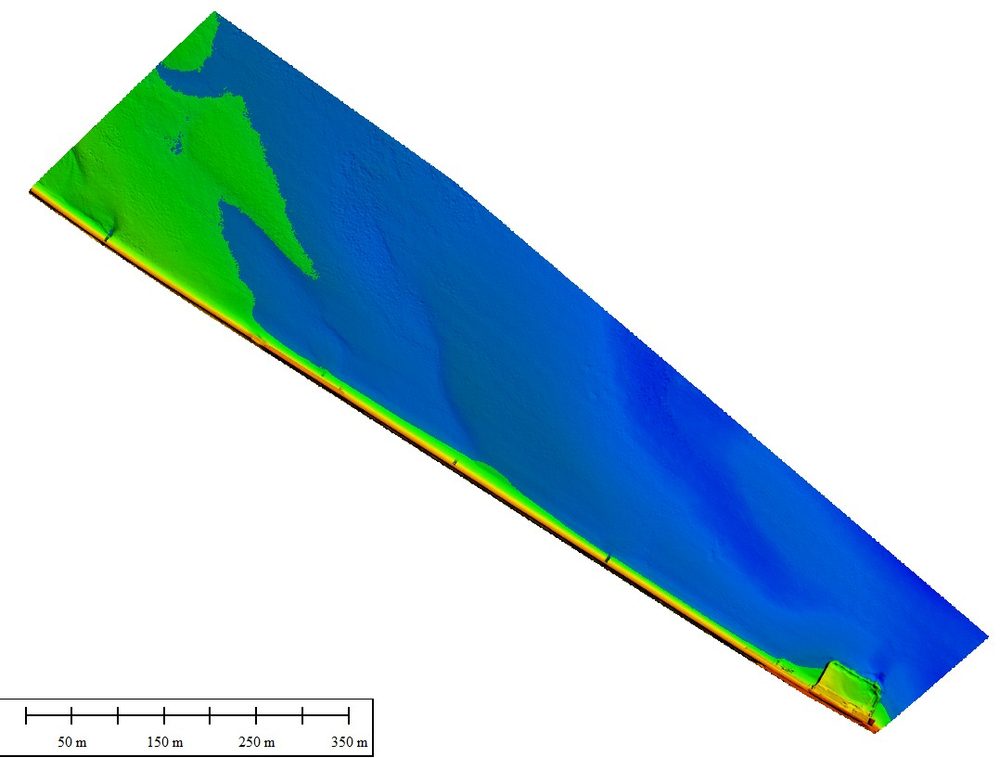
Colourised survey surface of the mapped intertidal area with a scale bar marked from fifty to three hundred and fifty metres
The mapped extent of the survey, colourised to show the surface detail across the intertidal zone.
Outcome

A complete picture of both landfall sites

The processed datasets gave the project team an accurate model of the intertidal zone at both landfall points, ready to sit alongside the offshore bathymetry and inform where and how the new cable is laid. The survey was completed without anyone having to work across the wet, exposed tidal ground.

Modern power cables are designed and built to last a very long time once they're in place. Where a cable does need attention, the defect registers on the cable's own monitoring instrumentation: monitors show how much energy is going in and how much is coming out, and anything that doesn't balance tells the operator there's an issue and roughly where to find it.

Comparative methodology

Why they chose us

Mapping an intertidal landfall means capturing ground that's only exposed for a short window around low tide. A drone flying photogrammetry at the lowest astronomical tide delivered accurate, complete coverage of the beach at both landfall points.

Timing
Lowest astronomical tide vs any other state of tide

The widest exposure of the intertidal zone is only available on the lowest tides, and that's exactly when the survey was flown.

Coverage
Full intertidal dataset vs isolated measurements

A single photogrammetry mission captured a large stretch of the coastline at both landfalls, rather than points here and there.

Outputs
DTM, point cloud, orthophoto vs a single output format

The client received three core georeferenced datasets per site, ready to combine with the bay bathymetry.

Efficient option Our method

Using a drone

This is what the job looked like using drone technology.

  • Flown at the lowest astronomical tide The survey was timed to the lowest tide of the period, so the widest possible slice of the intertidal zone was exposed and captured.
  • Full photogrammetric dataset A complete photogrammetry capture across a large stretch of the coastline at both landfall points.
  • Extensive ground control Ground control points laid across both sites before capture, tying the dataset to a known, accurate position.
  • Two landfalls in one project Both the point where the cable comes ashore and the point where it returns to the seabed were mapped.
  • Data ready to join the bay survey The beach datasets sit alongside the boat-based bathymetry to give one continuous picture of the route.
Project status Datasets issued
Manned approach Traditional method

Without a drone

What the job would have looked like without drone technology.

  • Restricted to the tide window The intertidal zone is only exposed for a short window around low tide, so any ground-based work has to fit inside that window.
  • Boat survey stops at the water's edge The bathymetry used in the bay was captured from a boat, which can't map the exposed beach in the intertidal zone.
  • On foot across soft tidal ground Covering a large stretch of wet, soft beach on foot is slow and physically limiting.
  • Isolated points, not a full surface Ground methods capture discrete measurements rather than complete, continuous coverage of the whole intertidal surface.
Operational impact Restricted by the tide window
Let's talk

Speak to an engineer about your project

Complex surveys and inspections require more than just a pilot. Our engineers can help you scope your requirements and indentify the right approach.

Talk to an engineer

+353 (0)21 202 8281

Quickest for technical scoping

Email your brief

info@engineerswithdrones.ie

Best for sending detailed specs

Next steps

Where to find out more

You can find out more about our photogrammetry and 3D mapping services, read about our work in the coastal and marine sector, or see how we mapped coastal landfall sites around Ireland. You can also browse our full range of survey and mapping services, or contact us here to ask what we can do for you.

Last Updated: