Drone operations like most modern industries are crammed full of jargon and acronyms. On this page we will explain what all the various terms mean. More importantly we will try to explain what is important to understand about a given technology.
3D mapping typically refers to the generation of a digital twin of a real world thing, be it a handheld object, a build/structure or a large piece of land. It is typically generated using either Photogrammetry but it can also be done using Lidar. Once generated a near photo realistic dimensionally accurate model can be then viewed assessed and manipulated in most any computer or handheld device. Also known as a digital twin or 3D modelling users can analyse these digital representations of objects in three dimensions.
The major advantage to this form of data presentation is the context it brings to the data. Every feature and defect is clearly seen within the larger context of the object. This makes it much more intuitive and efficient to work with with the data. This technique offers an up-to-date and comprehensive method of information collecting and visualisation. WHat we say here is "with 3D mapping you can bring the asset to the people instead of bringing the people to the asset". This means instead of ten different site visits by various parties there only needs ot be one visit thenall the rest cna be done in the office. More about 3D Mapping...
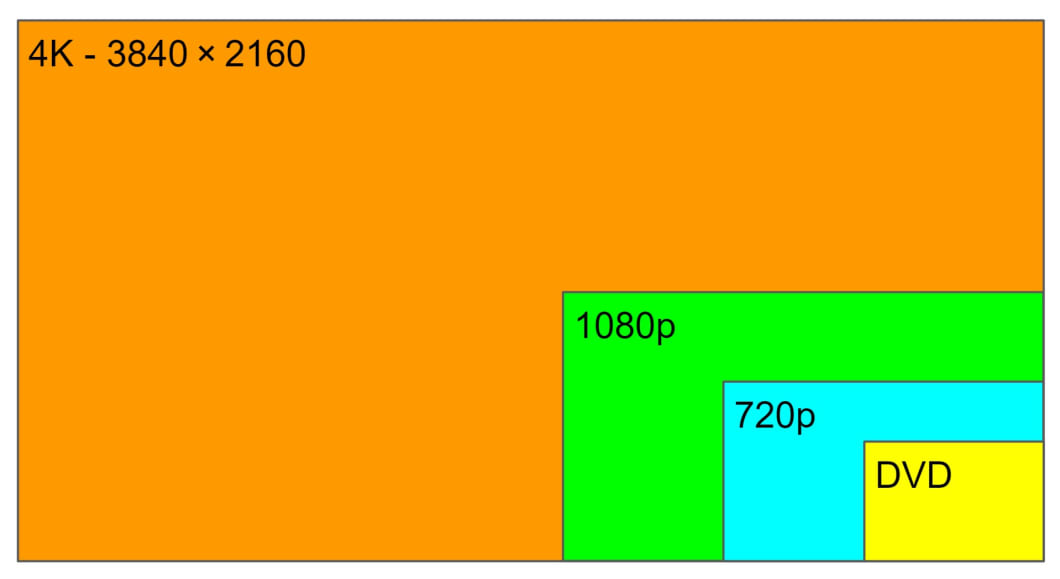
4K refers to a display resolution of approximately 4,000 pixels on the horizontal axis, which provides a significant increase in the amount of detail and clarity in visual media. The actual resolution is typically 3840x2160, four times the number of pixels found in a standard 1080p high-definition display. This ultra-high-definition technology is commonly used in modern television sets, computer monitors, and projectors to provide a more immersive and detailed viewing experience. With 4K, viewers can enjoy incredibly sharp and lifelike images with rich colors and deep contrast, making it a popular choice for gaming, streaming video content, and professional applications such as video editing and graphic design.
The advantages of 4K become more apparent on larger screens or when sitting closer to the screen.
An "assembly of people" is a technical term used in the EASA drone regulations. It describes a gathering of people where the individual persons are unable to move away due to the density of the people present. It is used to determine the amount of risk that is present ina given drone operation. For example flight over an assembly of people is prohibited in the Open Category of drone operations.
The reason it is important to be aware of any assembly of people is because of the flight restrictions that surround such gatherings. Any drone operator flying over an assembly of people without the proper authorisations would be in breach of the drone regulations and may subject to criminal proceedings.
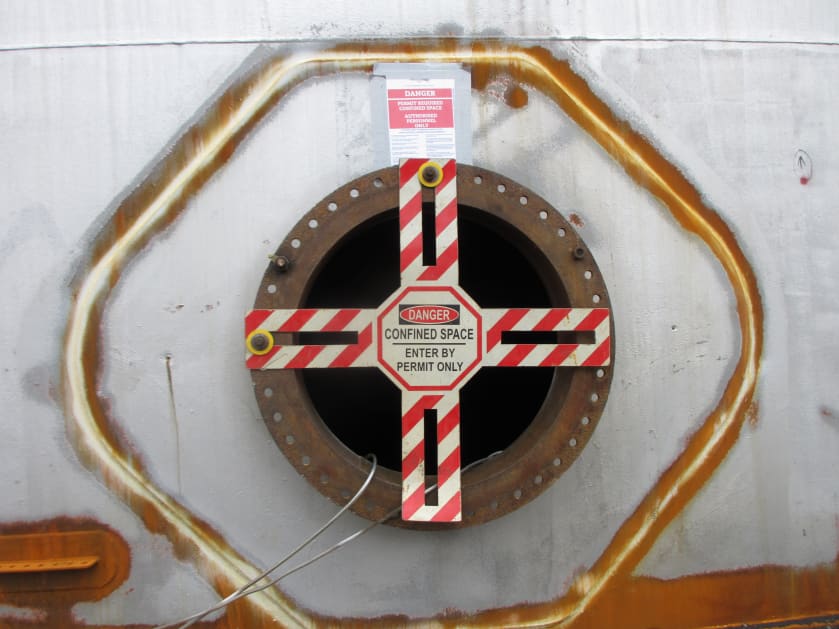
A confined space is an enclosed or partially enclosed area that is not intended for human occupancy and has limited means of entry and exit. Confined spaces can pose significant risks to workers, including lack of oxygen, toxic fumes, and physical hazards such as pinch points or moving parts. Examples of confined spaces include tanks, vessels, sewers, boilers, and storage bins. Entry into a confined space requires a high level of safety precautions, including hazard identification, ventilation, personal protective equipment, and a permit system. Proper training, equipment, and procedures are essential to ensure the safety of workers in confined spaces. More about confined space...
The use of dedicated confined space drones has significantly reduced the cost and risk associated with many confined space operations.
The term "controlled ground area" is a technical term used in the EASA drone regulations. It refers to the ground over which the drone is operated. The defining feature of a controlled ground area is that the drone operator can ensure that only involved persons are present in the area. If this cannot be ensured it is not a controlled ground area.
It is important to know about controlled ground as a drone operator as it is a key element in risk management in drone operations.
Moving soil between locations to level out the ground is known as cutting and filling. When earth is removed from above the required ground level, it is said to be "cut", and when earth is used to fill a hole to the desired ground level, it is said to be "filled". The method of cutting and filling is frequently employed to make an even soil surface. More about cut and fill...
A deliverable is a product or service created as part of a project and intended for client delivery. For example, a collection of images, a 3D model or a video created by Engineers with Drones and given to the asset/industry professional.
Specification of deliverables if one of the most important steps in our initial discussions with our clients. Specifying exactly what deliverables a client wants and to what level of precision can save the client a lot of time and cost in the long run.
A digital elevation model (DEM) made by a drone is a 3D representation of the Earth's surface created using high-resolution imagery captured by an unmanned aerial vehicle (UAV). The drone captures overlapping aerial photographs from different angles, which are then processed to generate a precise 3D model of the terrain. This model contains information about the height, slope, and contours of the land, and is typically used in various applications such as land surveying, urban planning, agriculture, and environmental monitoring. A drone-generated DEM provides accurate and detailed information that can be used to create maps, measure volumes, and analyze terrain features with a high degree of precision.
The advantage of a DEM is the lightweight file size coupled with
Digital Elevation Models provide a means to represent the Earth's surface in digital form. They play a crucial role in a variety of disciplines, from environmental science to urban planning. Here are some of the key advantages of DEMs:
While DEMs offer numerous advantages, it's also essential to consider their limitations. For instance, the accuracy and resolution of a DEM can vary, influencing the quality of analyses and applications. Proper understanding and handling of DEMs are crucial to ensure meaningful results.
A digital surface model (DSM) made by a drone refers to a 3D representation of the Earth's surface that is created through the use of remote sensing technology. Drones are equipped with sensors that capture high-resolution images of the ground surface from different angles, which are then processed and stitched together to create a comprehensive 3D map. The DSM is different from other elevation models, as it includes all surface features, including trees, buildings, and other objects on the ground. DSMs have a wide range of applications, including land management, urban planning, environmental monitoring, and disaster response.
A Digital Surface Model (DSM) is a 3D representation of a geographic area that shows the height, shape, and texture of the terrain and any objects on the surface. It is created using digital elevation data obtained from various sources such as aerial photography, LIDAR, or satellite imagery. DSMs can be used in a variety of applications, including urban planning, flood risk assessment, and infrastructure development. They provide a detailed view of the Earth's surface, allowing for accurate measurements of elevation and topography. DSMs are a valuable tool for analyzing and visualizing the landscape and can be used to support a wide range of geospatial analyses.
A digital terrain model (DTM) created by a drone refers to a highly accurate and detailed digital representation of the Earth's surface, generated through the use of unmanned aerial vehicles (UAVs) equipped with advanced sensors and cameras. These sensors collect a vast amount of data, which is then processed using specialized software to create a 3D model of the terrain. The resulting DTM is typically used for various applications such as urban planning, construction, forestry, agriculture, and natural resource management. The advantage of using a drone to create a DTM is its ability to capture data from hard-to-reach areas and produce high-resolution images with incredible accuracy.
A digital terrain model (DTM) is a digital representation of the Earth's surface that captures the elevation data of a particular area, represented in a grid format. It is created by using specialized software that analyzes data from various sources, such as satellite imagery, aerial photography, and ground-based surveys. The DTM accurately portrays the three-dimensional topography of the terrain, including the height and slope of the land, and can be used for a wide range of applications, such as urban planning, flood management, geological analysis, and environmental modeling. DTMs are widely used in the fields of cartography, geology, geography, and remote sensing, among others.
A digital twin is a virtual replica of a physical object, process, system or environment that is created using data and algorithms. It is a digital representation that mimics the behavior and characteristics of its physical counterpart, allowing for real-time monitoring, analysis and optimization. Digital twins are used in various industries, including manufacturing, healthcare, transportation and energy, to improve efficiency, reduce costs, and enhance performance. They enable predictive maintenance, simulation, and testing without the need for physical experimentation. Digital twins are powered by Internet of Things (IoT) devices, sensors, and other data sources that collect and transmit real-time data to the digital twin for analysis and decision-making.
DSM (Digital Surface Model), DTM (Digital Terrain Model), and DEM (Digital Elevation Model) are three commonly used terms in the field of geomatics and remote sensing. These models represent different types of 3D data models that are used to represent the elevation of the Earth's surface. Although they are often used interchangeably, there are some significant differences between these models.
A DSM represents the topmost surface of the Earth's terrain, including any vegetation, buildings, and other objects that may be present on the ground. In other words, a DSM is a digital representation of the Earth's surface with all features and objects included. DSMs are commonly used in applications such as urban planning, flood modelling, and environmental studies, where a detailed representation of the Earth's surface is required.
A DTM represents the bare Earth surface, excluding any objects or features above the terrain such as vegetation, buildings, and other structures. DTMs are used to study the Earth's surface in its natural form, and are commonly used in applications such as topographic mapping, hydrology, and soil mapping. DTMs are created by removing all features from a DSM, leaving only the terrain elevation data.
A DEM represents the elevation of the Earth's surface in a digital format, regardless of whether it is covered by objects or features such as vegetation or buildings. DEMs can be derived from both DSMs and DTMs, and are used in a wide range of applications, such as flood risk assessment, land management, and geological studies.
The main differences between DSMs, DTMs, and DEMs lie in the type of data they represent and the applications they are used for. DSMs represent the topmost surface of the Earth's terrain, while DTMs represent the bare earth.

Ground control points (GCPs) are reference points on the earth's surface that are identified and accurately measured using surveying techniques. In aerial mapping, GCPs are used as a basis for georeferencing aerial photographs or satellite imagery. By accurately determining the coordinates of GCPs, it is possible to correct the distortion and displacement caused by camera lens distortion and terrain relief in the aerial imagery. GCPs are typically located in areas of the imagery that have distinct features, such as road intersections, building corners or landmarks, and are used as reference points for accurately positioning the imagery in its true geographical location.
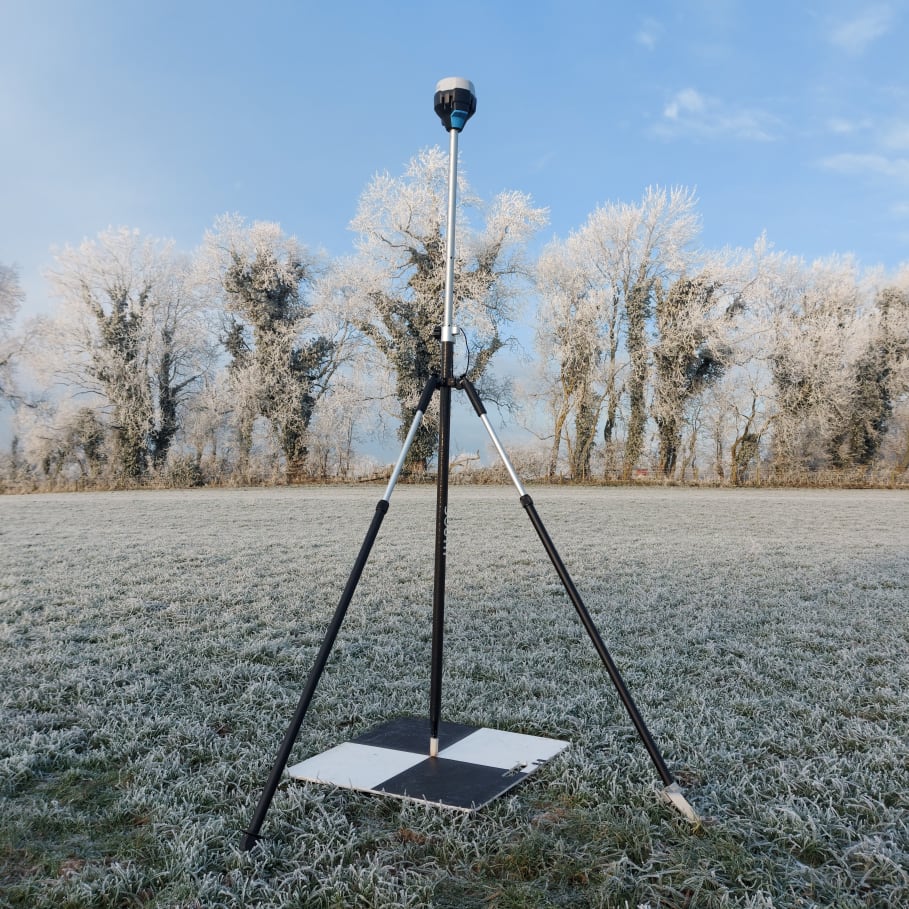
In summary, GCPs play a crucial role in ensuring the accuracy, reliability, and credibility of remotely sensed data. They provide a bridge between the real-world and the digital representation of it, ensuring that geospatial data truly reflects the ground truth.
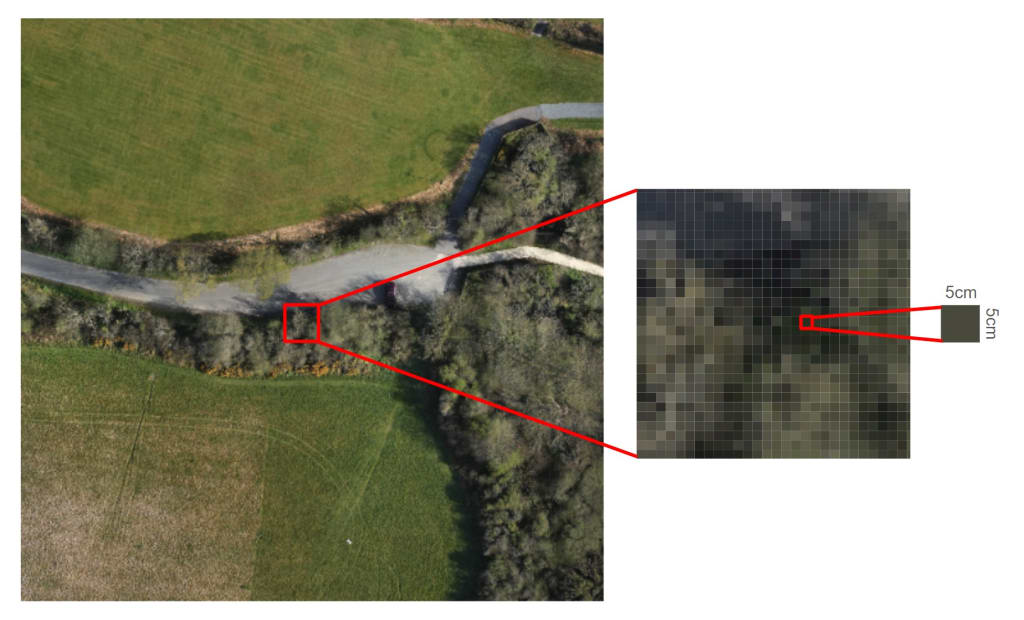
Ground Sampling Distance (GSD) refers to the distance between adjacent pixel centers in a remotely sensed image. In other words, it is the spatial resolution of an image on the ground, expressed in units of length per pixel. GSD is determined by the altitude of the sensor, the angle of the sensor's view, and the size of the detector array. Generally, the closer the sensor is to the ground, the higher the spatial resolution and the smaller the GSD. GSD is a crucial factor in remote sensing because it determines the level of detail that can be observed in an image. GSD is commonly used in a variety of applications such as land-use classification, forestry, and urban planning. For example, a smaller GSD is needed to detect small features like individual trees, whereas a larger GSD can be sufficient for identifying larger land cover features like urban areas or bodies of water. Ground sampling distance (GSD) refers to the distance between pixel centers measured on the ground. The smaller the GSD, the higher the spatial resolution of the image, meaning more detail can be captured in the image. In remote sensing, accuracy refers to how well an image or data set represents the real world. GSD can affect accuracy in a few ways: Spatial accuracy: A smaller GSD generally improves spatial accuracy because more detail is captured in the image. This means that the location of objects or features on the ground can be determined more precisely. Spectral accuracy: GSD can also affect spectral accuracy, which refers to how well an image or data set represents the reflectance or emission properties of the features on the ground. Smaller GSD can capture more detail in the spectral signature of objects, resulting in better spectral accuracy. However, a smaller GSD can also result in some challenges, such as increased data volume, processing time, and storage requirements. Additionally, the accuracy of the final product depends on many factors, including the quality of the input data, the processing algorithms used, and the accuracy of ground truth data used for validation.
Lidar drone mapping is the use of drones equipped with Light Detection and Ranging (Lidar) technology to create high-resolution 3D maps of terrain, buildings, and other objects. The drone emits laser beams that bounce off objects and return to the drone's sensors, creating a detailed point cloud of the object or terrain. The resulting data can be used in a variety of applications, including urban planning, construction, and environmental monitoring. Lidar drone mapping is faster and more accurate than traditional surveying methods and can cover a larger area with greater detail in less time, making it an increasingly popular tool for mapping and surveying professionals. More about LIDAR...
Multispectral aerial mapping is a process of using aerial sensors to collect data on a specific geographic area in multiple spectral bands beyond what the human eye can see. This method of mapping can capture various types of data such as visible light, infrared, thermal, and others. The captured data is then analyzed to create high-resolution maps that reveal detailed information about the area, such as vegetation health, water quality, land cover, and temperature. This mapping technique is commonly used in agriculture, forestry, environmental monitoring, urban planning, and disaster management. It provides valuable insights and helps to make informed decisions by accurately assessing and managing natural resources and land use.
Normalized Difference Red Edge (NDRE) is a vegetation index that measures the difference between the reflectance of light in the near-infrared (NIR) and red-edge regions of the electromagnetic spectrum. This index is commonly used to estimate the chlorophyll content and overall health of vegetation in agricultural and ecological applications. NDRE is calculated by subtracting the reflectance values of the red-edge band from those of the NIR band, and then dividing the result by the sum of the reflectance values of both bands. Normalizing the values reduces the effects of atmospheric interference and variations in illumination, allowing for accurate comparisons of vegetation health across different locations and times.
NDVI (Normalized Difference Vegetation Index) and NDRE (Normalized Difference Red Edge) are both remote sensing indices used to measure vegetation health and biomass. The main difference between NDVI and NDRE lies in the spectral bands they use to calculate vegetation indices. NDVI uses near-infrared and red light, while NDRE uses near-infrared and red edge light. Red edge light is the spectral region between red and near-infrared. NDRE is more sensitive to changes in biomass and plant stress than NDVI due to its ability to detect changes in chlorophyll content and plant structure in the red edge region. NDVI is more commonly used for crop monitoring, while NDRE is more useful in research applications.
Normalized Difference Vegetation Index (NDVI) is a commonly used remote sensing index that quantifies the vegetation density and health of an area by comparing the reflectance of near-infrared and visible light. NDVI values range from -1 to 1, with higher values indicating more dense and healthy vegetation. NDVI has numerous applications in agriculture, ecology, and climate studies, as it can provide valuable information on vegetation growth, biomass, and productivity. It can also be used to monitor changes in land use and land cover, detect drought conditions, and predict crop yields. NDVI is calculated using multispectral satellite imagery or ground-based sensors.
NDVI (Normalized Difference Vegetation Index) and NDRE (Normalized Difference Red Edge) are both remote sensing indices used to measure vegetation health and biomass. The main difference between NDVI and NDRE lies in the spectral bands they use to calculate vegetation indices. NDVI uses near-infrared and red light, while NDRE uses near-infrared and red edge light. Red edge light is the spectral region between red and near-infrared. NDRE is more sensitive to changes in biomass and plant stress than NDVI due to its ability to detect changes in chlorophyll content and plant structure in the red edge region. NDVI is more commonly used for crop monitoring, while NDRE is more useful in research applications.
Optical zoom is a feature found in cameras that allows you to change the focal-length of the lens, which in turn magnifies the image. Unlike digital zoom, which simply enlarges the pixels of an image, optical zoom physically moves the lens elements to zoom in or out, resulting in a higher-quality, more detailed image.
Optical zoom is better than digital zoom for several reasons. Firstly, optical zoom maintains the image quality and sharpness because it captures more detail from the subject. In contrast, digital zoom often results in a pixelated, blurry image because it enlarges the existing pixels of an image, which degrades the quality.
Secondly, optical zoom allows you to get closer to your subject without physically moving closer, which can be useful in situations where you cannot or do not want to approach your subject closely. This can be especially helpful for wildlife photography or for taking photos of events from a distance.
Overall, optical zoom is a valuable feature that can help you capture high-quality, detailed images from a distance, making it a must-have for many photographers.

An orthomosaic is a high-resolution, georeferenced image produced by stitching together multiple overlapping aerial or drone images. Unlike a regular mosaic, an orthomosaic corrects for perspective distortion and terrain variations, resulting in a highly accurate and detailed representation of the area being imaged.
Orthomosaics are used in a variety of fields, including agriculture, construction, urban planning, and environmental monitoring. For example, in agriculture, orthomosaics can be used to create detailed maps of crop health and yield, allowing farmers to optimise their planting and fertilization strategies. In construction, orthomosaics can be used to monitor progress and identify potential safety hazards on a job site. In urban planning, orthomosaics can be used to map out infrastructure and identify areas in need of maintenance or repair. And in environmental monitoring, orthomosaics can be used to track changes in land use, detect changes in water quality, and monitor wildlife habitats.
An orthophoto is a georeferenced aerial or satellite photograph that has been corrected for topographic relief, camera tilt, and other distortions so that it has a uniform scale and can be used for precise measurement and mapping.
To create an orthophoto, multiple overlapping images of an area are captured from different angles and heights. These images are then corrected for distortions, such as perspective and relief displacement, using photogrammetric techniques. The result is an image that has a uniform scale and can be used for accurate measurements of distance, area, and volume.
Orthophotos are used in a variety of applications, including urban planning, land surveying, environmental management, and emergency response. They are particularly useful for identifying and mapping changes in land use, such as the expansion of urban areas or the conversion of natural habitats. Orthophotos can also be used to create detailed terrain models and to plan the placement of infrastructure, such as roads and buildings.
Photogrammetry is a technique that involves the use of photographs to measure and extract three-dimensional information about an object or scene. It involves taking multiple photographs of an object or area from different angles and then using software to analyze the images and create a 3D model. The process involves identifying common points on the photographs and using these points to triangulate the location of the object in three-dimensional space.
Photogrammetry has many applications in various fields, such as surveying, architecture, engineering, and mapping. It is used to create accurate and detailed maps, models of buildings and landscapes, and to measure distances and volumes. In archaeology, photogrammetry is used to create 3D models of ancient artifacts and structures, allowing researchers to study and analyze them in detail without risking damage to the original objects. It is also used in cinematography to create special effects and computer-generated imagery. With the advancement of technology, photogrammetry has become a powerful tool for capturing and analysing complex visual data. More about 3D Mapping...
A point cloud is a three-dimensional (3D) data representation of physical objects or environments. It is a collection of data points in space, each point representing a coordinate in 3D space. These points can be generated by various scanning or imaging techniques such as LIDAR, photogrammetry, or laser scanning.
Each point in a point cloud carries information about the location, color, and reflectance of the surface it represents. By combining millions of these individual points, a point cloud can create a highly detailed and accurate 3D representation of the scanned environment.
Point clouds are commonly used in a variety of industries such as architecture, engineering, and construction, as well as for virtual reality and gaming applications. They also play a vital role in the development of autonomous vehicles and robotics, providing a precise and comprehensive understanding of the surrounding environment.
This data can be used to create a wide range of 3D models and visualizations. With a point cloud, you can create accurate and detailed 3D models of objects, landscapes, and buildings. These models can be used for architectural and engineering purposes, such as designing and planning buildings or visualizing changes to a landscape. Point clouds can also be used in the film and gaming industries to create realistic environments and characters.
Prescription maps for farms are customized maps that depict the spatial variability of crop health and productivity across a field, enabling farmers to implement targeted management strategies. These maps are created by integrating various data sources, such as yield history, soil type, topography, and weather data, using advanced geospatial technologies. Based on this data, farmers can generate variable rate prescriptions for inputs such as fertilizers, pesticides, and seeds, and apply them precisely where needed. This approach can optimise crop yields, reduce input costs, and minimise environmental impact. Prescription maps are becoming increasingly popular as a precision agriculture tool, helping farmers make data-driven decisions to maximise their profitability and sustainability.
By measuring the reflected and emitted radiation of an area from a distance, remote sensing is the process of identifying and keeping track of the physical features of a location. Remotely sensed images are captured by specialised cameras to form an accurate reading of the Earth.
Real-Time Kinematic (RTK) is a type of satellite-based positioning system that is commonly used in surveying and mapping applications. RTK technology uses a combination of GPS (Global Positioning System) and GLONASS (Global Navigation Satellite System) signals to provide highly accurate and precise location information. Unlike traditional GPS systems that provide accuracy within a few meters, RTK systems can provide Centimetre-level accuracy in real-time. RTK works by using a fixed base station that receives satellite signals and transmits corrections to a mobile rover receiver in real-time. This allows the rover to calculate its precise location relative to the base station with high accuracy and speed.
Stockpile volume measurement is a technique used to establish the dimensions, weight, or volume of the accumulated stock of a business's goods or materials, usually held in reserve for use in the event of a scarcity or emergency. More about thermal imaging...
Terrain following is a technique used in drones to maintain a consistent altitude above the terrain below. In this method, the drone's altitude is automatically adjusted to follow the contours of the terrain, ensuring that it remains at a safe and consistent distance from the ground, even as the ground level changes. To achieve terrain following, drones use a combination of sensors such as GPS, altimeters, and terrain mapping software. The GPS is used to obtain the drone's current position and altitude, while the altimeter is used to measure the drone's height above the ground. The terrain mapping software provides detailed information about the ground surface, which is used to adjust the drone's altitude in real-time. This technique is particularly useful in areas with rugged or uneven terrain, where maintaining a consistent altitude can be difficult. Terrain following enables drones to fly safely and efficiently over these types of terrains, allowing for a range of applications such as surveying, mapping, and search and rescue operations.
Drone-based thermal imaging is a technology that utilizes unmanned aerial vehicles (UAVs) equipped with thermal cameras to capture high-resolution thermal images of various objects or areas. This technology allows for the detection and measurement of temperature variations in a scene, enabling the identification of heat signatures of objects and their surroundings.
Drone-based thermal imaging can be used in a variety of applications, including search and rescue operations, inspection of power lines, pipelines, and other infrastructure, monitoring of wildlife, and identifying energy inefficiencies in buildings. The technology can detect temperature differences as small as 0.1°C, making it a valuable tool for detecting hotspots and identifying potential hazards.
In operation, the drone is flown over the area of interest, capturing thermal images of the scene. The images are then processed using specialized software that converts the temperature data into visible images that can be analyzed and interpreted. The resulting images can show temperature variations in a range of colors, with red and yellow indicating hot spots, and blue and green indicating cooler areas.
Overall, drone-based thermal imaging is a powerful technology that provides accurate, non-invasive, and efficient data for various applications. Its ability to provide high-resolution thermal imagery from a safe distance makes it a valuable tool for numerous industries and professionals. More about thermal imaging...
UAV (Unmanned Aerial Vehicle): UAV is the technical term for a drone. It refers to any aircraft that can be operated without a human pilot on board.
UAS (Unmanned Aircraft System): UAS encompasses not just the drone itself (UAV) but also the associated ground control station, communication systems, and any additional equipment required for its operation.
An "uninvolved person" is a technical term used in the EASA drone regulations. It refers to a person who are not participating in the UAS operation or who are not aware of the instructions and safety precautions given by the UAS operator;
VLOS, or Visual Line of Sight, is a term used to describe a requirement for drone operators to maintain a clear, unobstructed view of their unmanned aerial vehicles (UAVs) at all times during flight. This means that the operator must be able to see the drone with their own eyes, without the use of any devices like binoculars or first-person view (FPV) goggles. The purpose of the VLOS requirement is to ensure the safety of the drone and people around it, as the operator can quickly react to any potential hazards or malfunctions. Additionally, VLOS helps to prevent drone collisions with other aircraft and structures by allowing the operator to maintain situational awareness.
Extended Visual Line of Sight (EVLOS) refers to the ability of a drone operator to maintain a continuous line of sight with their drone, even when it is flying beyond their direct line of sight. EVLOS allows drones to fly at greater distances and altitudes than would be possible under Visual Line of Sight (VLOS) rules, which require that the operator maintains direct visual contact with the drone at all times. EVLOS typically involves the use of ground-based spotters, cameras, or other technologies to provide the operator with a live video feed of the drone's location and surroundings. EVLOS is an important consideration for commercial drone operations, such as aerial surveys, inspections, and deliveries, which may require flights beyond VLOS ranges.
Beyond Visual Line of Sight (BVLOS) refers to the operation of unmanned aerial vehicles (UAVs) or drones beyond the direct visual range of the operator or pilot. This means that the drone is flown beyond the pilot's line of sight, where the pilot cannot directly see the drone with their unaided eyes. Instead, the pilot relies on sensors and other technology to control the drone from a remote location. BVLOS operations are becoming increasingly popular for applications such as aerial surveying, inspection of infrastructure, and delivery services. However, they also require special authorization and compliance with regulatory guidelines due to safety concerns.
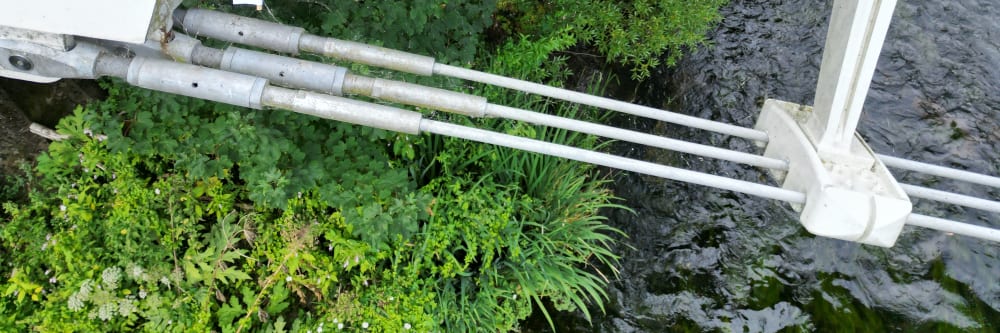
Working at height refers to any work activity that takes place above ground level or a lower level, where a person could be injured if they fell from that position. This type of work may be performed on ladders, scaffolds, roofs, platforms, or any other elevated surface. Workers who perform tasks at height must follow strict safety procedures and use appropriate equipment to prevent falls and injuries. The use of fall protection systems, including harnesses, guardrails, and safety nets, is essential for ensuring worker safety. Employers have a legal responsibility to provide their workers with adequate training, supervision, and equipment to carry out their work at height safely.